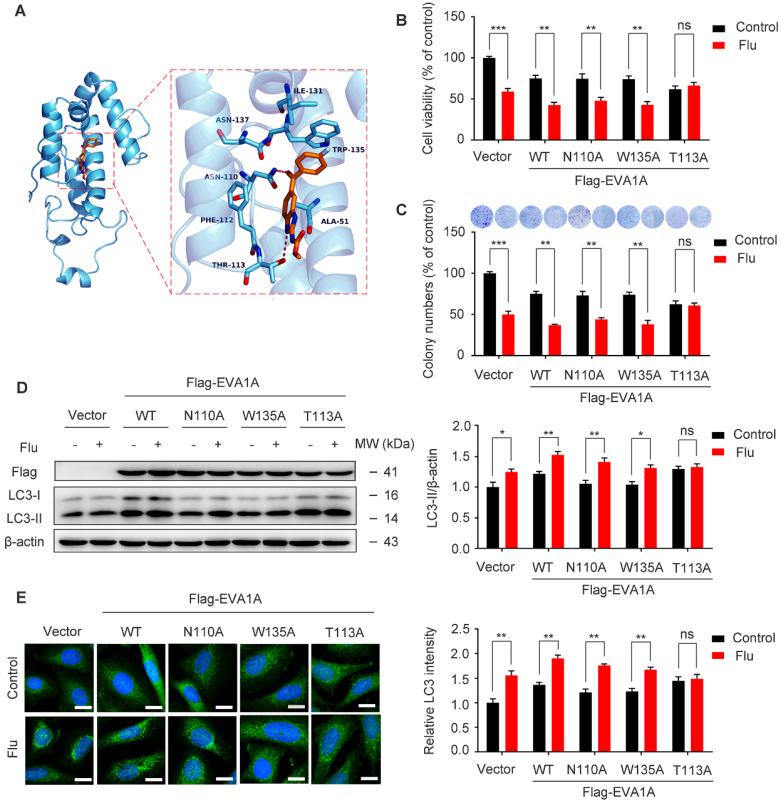
Figure 9.
Effect of EVA1A mutant on the proliferation and autophagy regulated by flubendazole in TNBC cells. (A) The predicted binding mode of flubendazole with EVA1A. General and detailed views of interactions between flubendazole and EVA1A were presented. (B) MDA-MB-231 cells were transfected with empty vector, wild type EVA1A (EVA1AWT) and EVA1A mutants (EVA1AN110A, EVA1AW135A, EVA1AT113A) respectively for 24 h, followed by treatment with or without flubendazole (0.5 µM) for 24 h, cell viability was measured by MTT assay. (C) MDA-MB-231 cells were transfected with empty vector, wild type EVA1A (EVA1AWT) and EVA1A mutants (EVA1AN110A, EVA1AW135A, EVA1AT113A) respectively for 24 h. After treatment with or without flubendazole (0.5 µM) for 2 weeks. Representative images and quantification of colonies were shown. (D) MDA-MB-231 cells were transfected with empty vector, wild type EVA1A (EVA1AWT) and EVA1A mutants (EVA1AN110A, EVA1AW135A, EVA1AT113A) respectively for 24 h, followed by treatment with or without flubendazole (0.5 μM) for 24 h. Then, the expression levels of EVA1A and LC3 was determined by immunoblotting analysis. β-actin was measured as a loading control. (E) MDA-MB-231 cells were transfected with empty vector, wild type EVA1A (EVA1AWT) and EVA1A mutants (EVA1AN110A, EVA1AW135A, EVA1AT113A) respectively for 24 h, followed by treatment with or without flubendazole (0.5 µM) for 24 h. Representative images with quantification of LC3 intensity were shown. Scale bar, 20 µm. Data are expressed as mean ± SEM. All data were representative of at least three independent experiments. *, P < 0.05, **, P < 0.01, ***, P < 0.001. Statistical significance compared with respective control groups.

