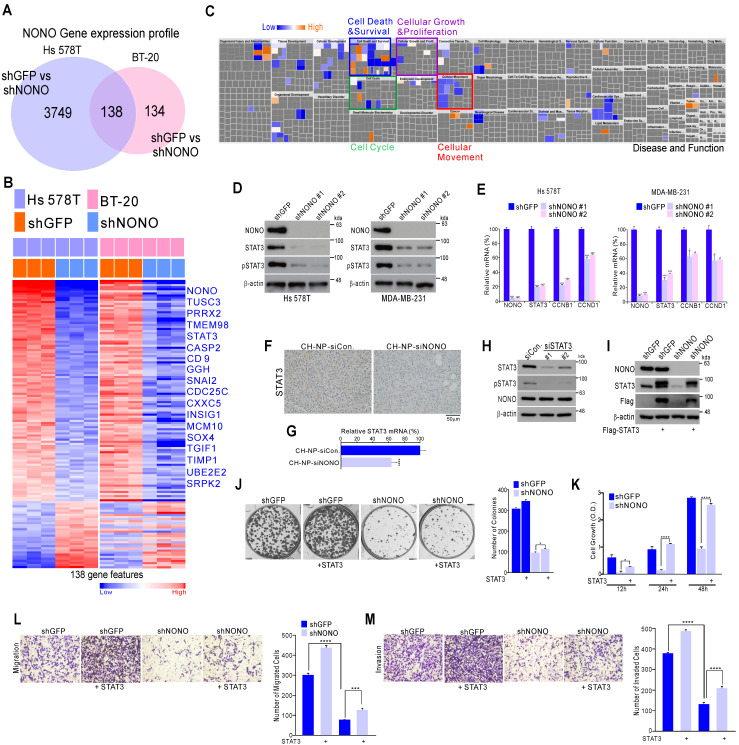
Figure 3.
NONO regulates STAT3 gene expression and thereby governs TNBC cell growth (A) Gene expression signatures specific to the loss of NONO expression via shNONO in two TNBC cell lines. Genes in the Venn diagram were selected by applying Class Comparison Analysis from the BRB array tool (p < 0.001). (B) Gene expression profile presented in a matrix format. In this matrix, red and blue indicated relatively high and low expression, respectively, as indicated in the scale bar (log2-transformed scale). Genes with oncogenic potential are listed. (C) Ingenuity Pathway Analysis (IPA) of the genes differentially expressed after NONO silencing. (D-E) Western blot and (D) qRT-PCR (E) analysis of STAT3-associated genes in TNBC cells after infection with the indicated lentivirus. (F-G) Representative immunohistochemistry image (F) and qRT-PCR (G) analysis after silencing of NONO in a xenograft model. (H) Western blot analysis of NONO and STAT3 after treatment of MDA-MB-231 cells with siSTAT3. (I-M) Rescue experiments following the introduction of STAT3. After infection with shGFP or shNONO, the Flag-STAT3 plasmid was transfected into MDA-MB-231 cells. This was followed by western blotting (I), CFA (J), CCK8 (K), migration (L) and invasion (M) assays. Data represent the means plus standard deviations from three independent replicates. A student's t-test was used to examine statistical significance (*p < 0.05, **p < 0.01, ***p < 0.005, and ****p < 0.001).

