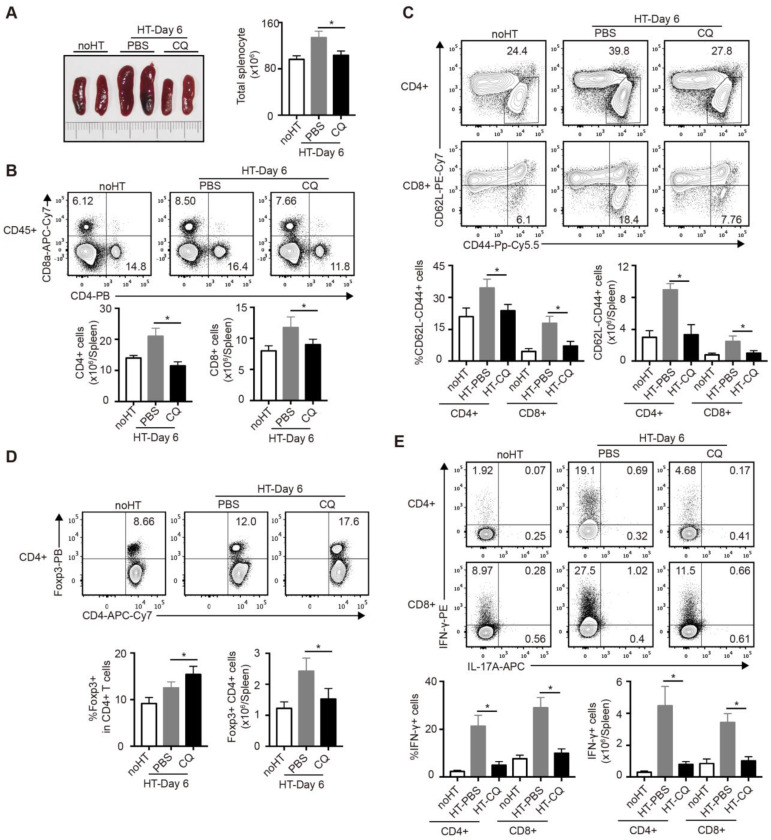
Figure 4.
Impacts of CQ on the subsets of T cells in the spleen after heart transplantation. (A) Representative images of the spleens (two pictures/group) and total numbers of splenocytes were manually calculated. (B) FCM analysis of the proportions and numbers of CD4+ T cells and CD8+ T cells from spleens harvested from each group. (C) FCM plots and histograms show the percentage of effector (CD62LloCD44high) CD4+ and CD8+ T cells in each group. (D) FCM plots and histograms show the ratios of Tregs (Foxp3+) in CD4+ T cells and the number of the Foxp3+CD4+ T cells. (E) FCM analysis of the percentage of CD4+ and CD8+ T cells secreting IFN-γ or IL-17A. Data are the mean ± SD and representative of three independent experiments (n=6). *p<0.05; unpaired Student's test.

