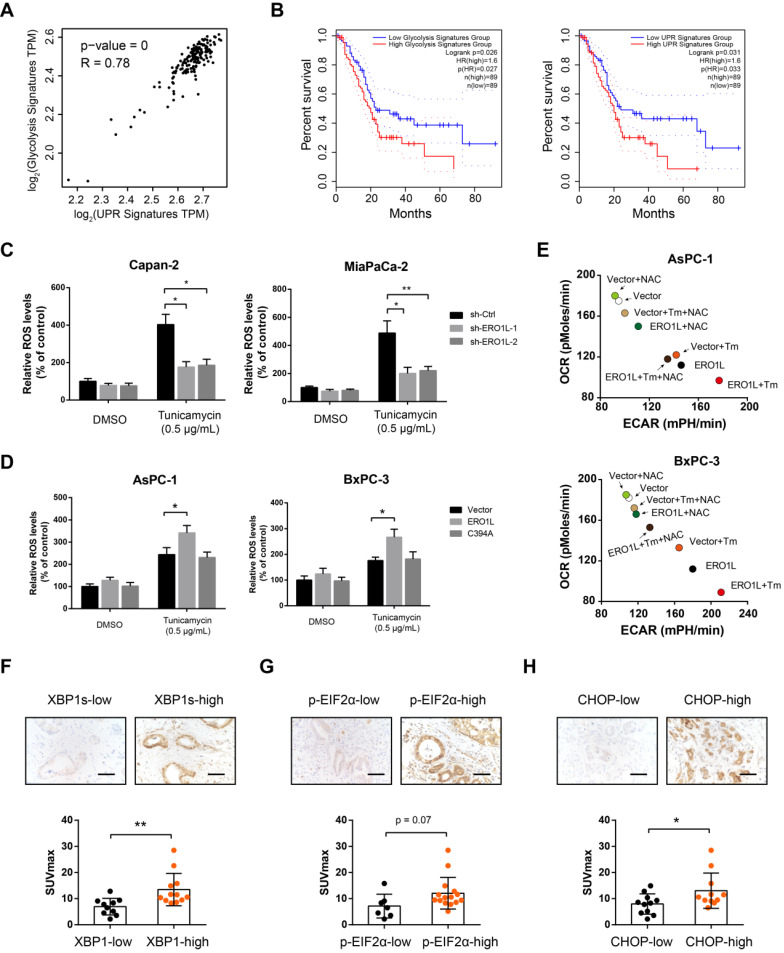
Figure 7.
Correlation between UPR and glycolysis genetic signature in human PDAC. (A) Correlation analyses between UPR and glycolysis gene expression signature in TCGA cohort. (B) Kaplan-Meier graphs showing the association of UPR and glycolysis gene expression signature with PDAC patient survival. (C) Effects of ERO1L knockdown on ROS generation under the condition of ER stress in Capan-2 and MiaPaCa-2 cells. (D) Effects of ERO1L-WT or ERO1L-C394A overexpression on ROS generation under the condition of ER stress in AsPC-1 and BxPC-3 cells. (E) Effect of ERO1L overexpression on PDAC cell glycolysis and OXPHOS in the presence or absence of ER stress and N-acetyl cysteine (0.2 mM) treatment. (F-H) Representative images of spliced XBP1 (F), phosphorylated eIF2α (G), and CHOP (H) expression in tumor tissues from PDAC patients who received preoperative 18F-FDG PET/CT examination; scale bar: 50 µm; the difference in the SUVmax value between indicated groups was analyzed. *P < 0.05 and **P < 0.01.

