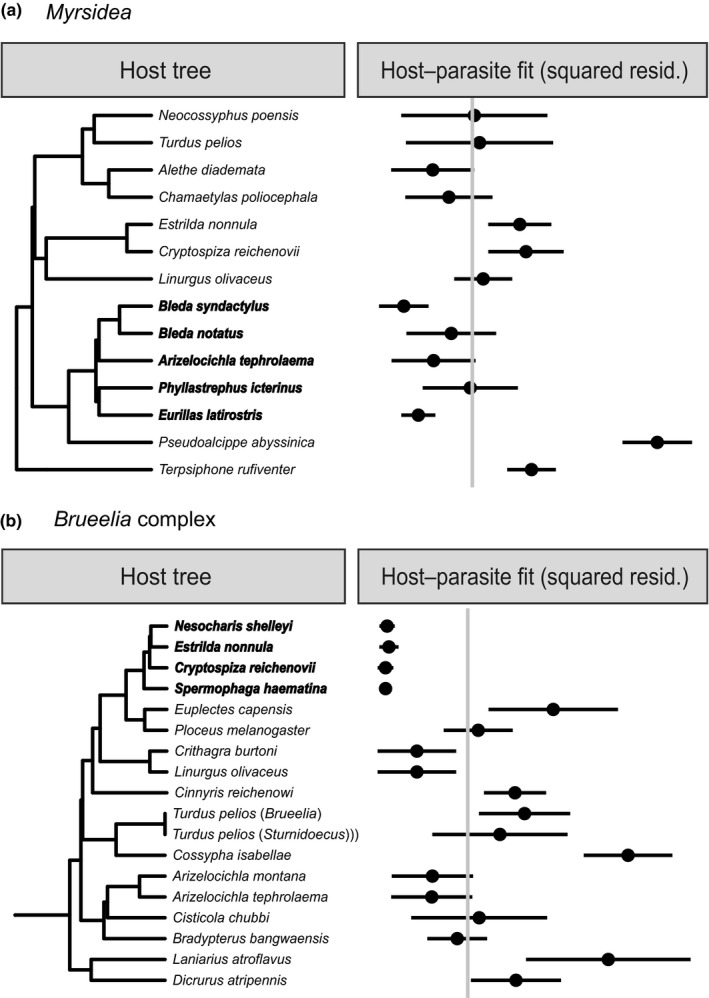
FIGURE 5.

Contribution of individual host–parasite associations to the global codivergence signal based on Procrustes analysis of distance matrices between Myrsidea lice and their hosts (a) and Brueelia complex lice and their hosts (b). Squared residual 95% confidence intervals are shown. The dashed line indicates the median squared residual value. Bulbul (Pycnonotidae) host associations with Myrsidea lice and Waxbill (Estrildidae) host associations with Brueelia complex lice are shown in bold
