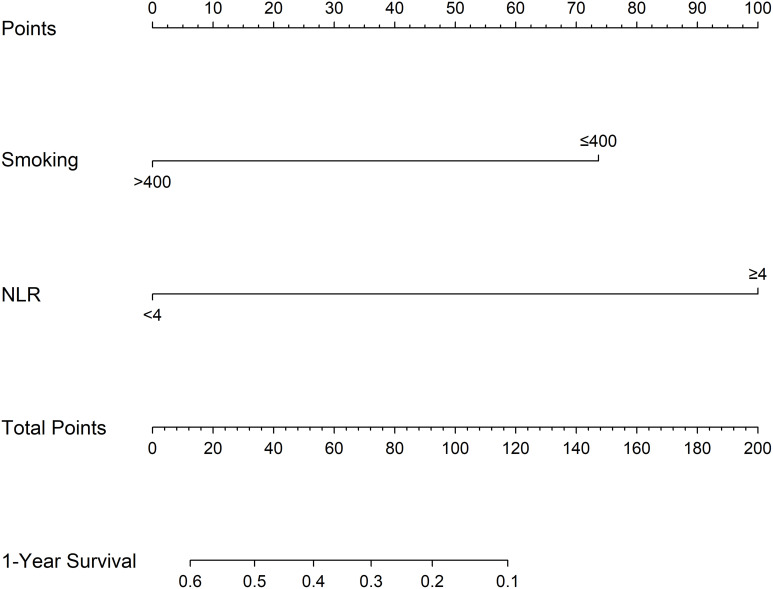
Figure 5.
Non-small cell lung cancer immunotherapy prognosis score (NLCIPS) column chart: values for each patient are located on each variable axis, and a line is drawn up to determine the number of points obtained for each variable value. The sum of these numbers is on the “total points” axis, and a line is drawn below the survival axis to determine the probability of 1-year progression-free survival.

