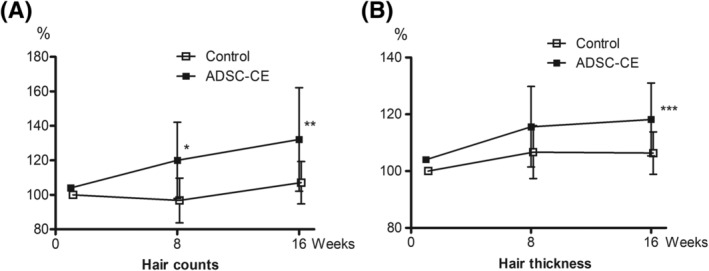
FIGURE 3.

Percentage change from baseline in hair count (A) and diameter (B) over 16 weeks (intention‐to‐treat analysis). Data are means ± SD (Control group n = 19, ADSC‐CE group n = 19). *P = .002, **P = .008, ***P = .026. ADSC‐CE, adipose‐derived stem cell constituent extract
