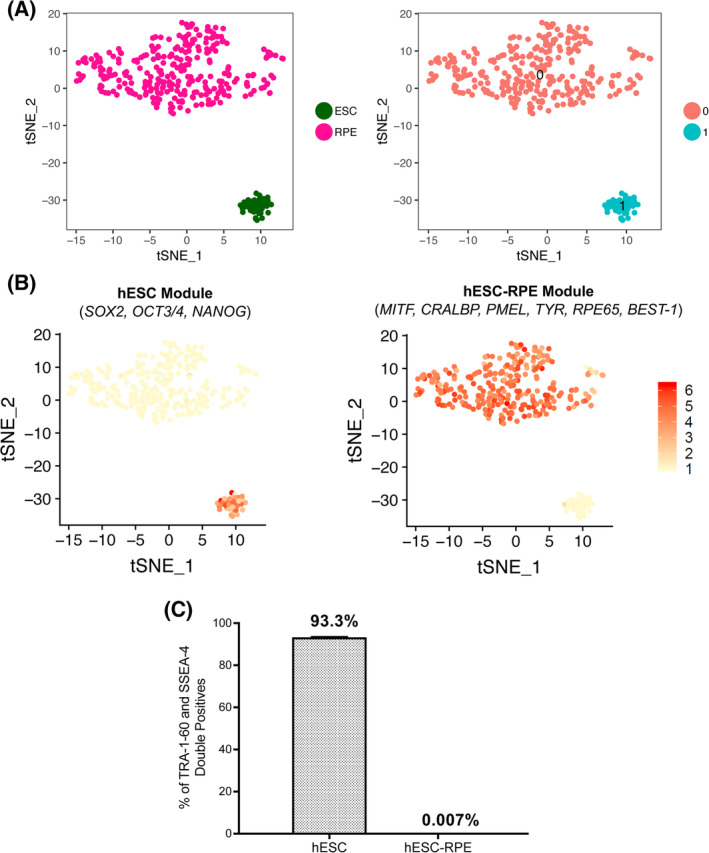
FIGURE 3.

Cell purity assessment of hESC‐RPE. A, Left panel: t‐SNE distribution of 42 hESC and 285 differentiated hESC‐RPE cells. Right panel: Unbiased clustering of analyzed cells based on differentially expressed genes. B, Modular expression of selective hESC and hESC‐RPE markers in hESC and hESC‐RPE cluster of cells. C, Bar graph showing the percentage of hESC or hESC‐RPE co‐expressing SSEA‐4 and TRA‐1‐60. Bars represent mean ± SD from three independent experiments. hESC, human embryonic stem cell; RPE, retinal pigment epithelial
