FIGURE 2.

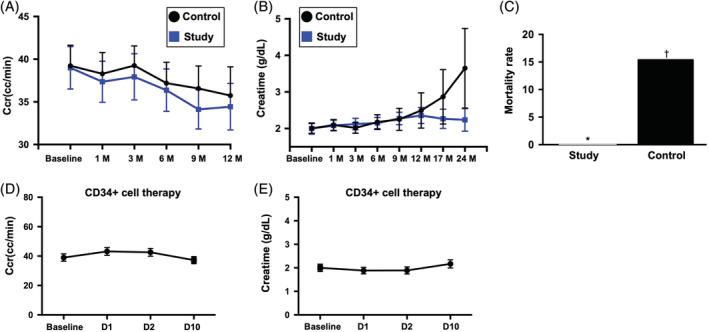
The time courses of Ccr and serum level of creatinine and combined untoward clinical outcome in study and control patients. A, Illustrating the time courses (ie, from baseline to 12 months) of Ccr between group 1 (ie, CD34+ cell–treated group) and group 2 (ie, control group). The analytical results showed that the Ccr did differ among the time points of prior to and at 1, 3, 6, 9, and 12 months (ie, serial changes) among the group 1 or group 2 patients or between groups 1 and 2 patients prior to and at any time point after CD34+ treatment. No significant difference was found at any time points between group 1 and group 2. B, Demonstrating the time courses (ie, from baseline to 12 months) of creatinine level between group 1 (ie, CD34+ cell–treated group) and group 2 (ie, control group). The analytical results showed that this parameter did differ among the time points of prior to and at 1, 3, 6, 9, and 12 months (ie, serial changes) among the group 1 or group 2 patients or between groups 1 and 2 patients prior to and at any time point after CD34+ treatment. C, Showing the combined endpoint of untoward clinical outcome (ie, dialysis or death during 12‐month follow‐up was significantly lower in group 1 than in group 2, * vs †, P = .038. D, Displaying the short‐term intervals of Ccr prior to and after CD34+ cell therapy. As compared with the baseline, this parameter was relatively lower after (ie, at days 1 to 10 after cell therapy) the cell therapy. E, Showing the short‐term intervals of creatinine level prior to and after CD34+ cell therapy. As compared with the baseline, this parameter was also relatively lower after (ie, at days 1 and 2 after cell therapy) the cell therapy. Ccr, creatinine clearance rate; D, day; M, month
