
FIGURE 1.
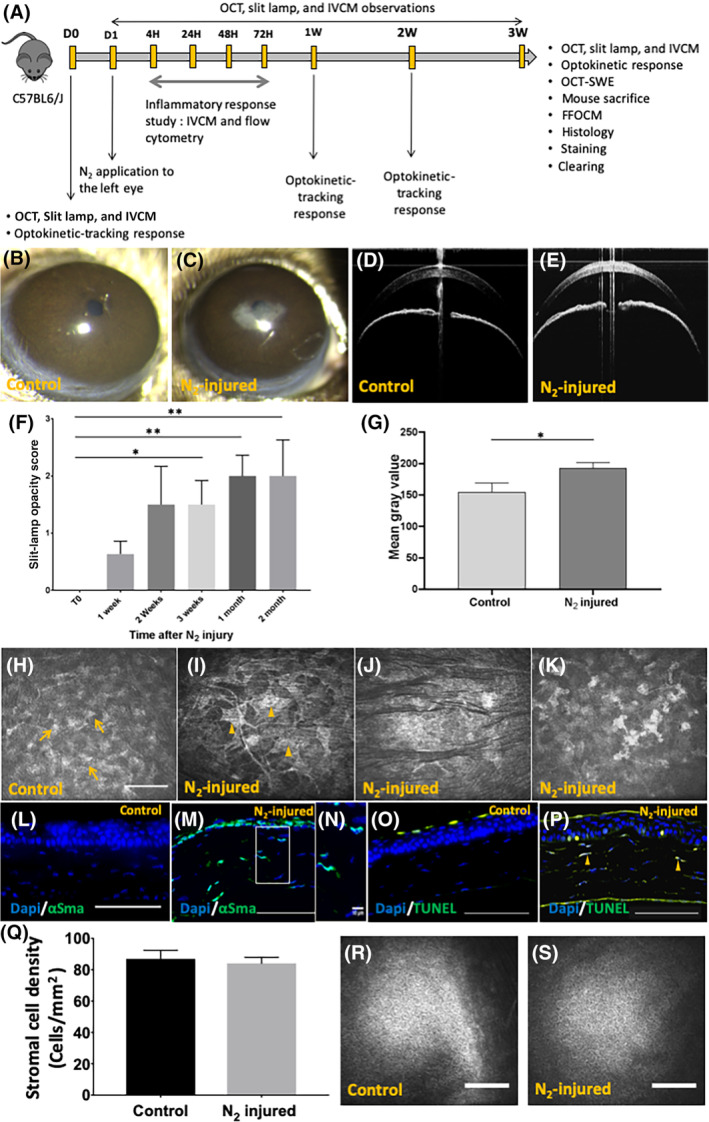
Corneal opacity mouse model development. A, Schematic representation of corneal mouse model development study. Fourty‐four mice: development of the corneal opacity mouse model. Twenty‐six mice: slit lamp for days 0 to 3 months. IVCM and OCT. Sixteen mice: inflammatory response analysis. Two mice: clearing experiment. B,D, Slit‐lamp and OCT observations of control (right eye) mouse corneas. C,E, Slit‐lamp and OCT observations after 3 weeks of N2‐injured mouse corneas (left eye). F, Slit‐lamp opacity score calculated 3 weeks after N2 application. G, Mean gray value of OCT cross sections determined by the ImageJ software. H‐K, IVCM images of normal cornea (H) and N2‐injured cornea (I, J, K). Unremarkable keratocytes can be observed in normal cornea (H, arrow) and myofibroblasts (I, arrowhead), hyporeflective striae (J), and nucleus condensation (K) in injured cornea 3 weeks after N2 application. L,M, Immunofluorescence staining of α‐SMA in control (L) and injured (M, N) cornea. O,P, TUNEL test in normal cornea (O) and injured cornea (P). Arrowheads show apoptotic stromal cells (P). Q, Stromal cell density was assessed from images obtained with IVCM in 44 mice. R,S, Normal endothelial appearance in control and N2‐injured corneas. Scale bars = 100 μm. Error bars = ±SEM. *P < .05; **P < .01. α‐SMA, alpha‐smooth muscle actin; IVCM, in vivo confocal microscopy; OCT, optical coherence tomography