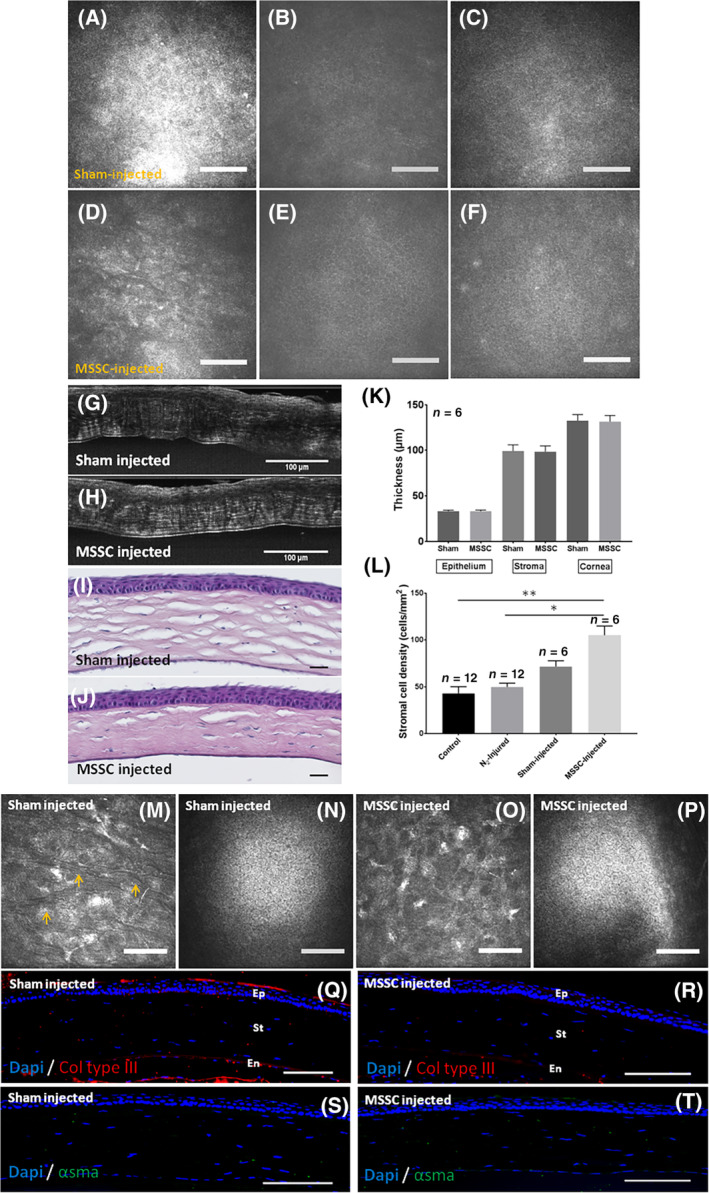
FIGURE 6.

Epithelial and stromal characterization after MSSC injection. A‐C, IVCM en face view of the epithelial layer 3 months after sham injection. D‐F, IVCM en face view of the epithelial layer 3 months after MSSC injection. G,H, FFOCM cross sections of the cornea after sham (G) and MSSC (H) injections. I,J, Hematoxylin and eosin staining of corneal cross sections after sham (I) and MSSC (J) injections. K, Epithelial, stromal, and corneal thicknesses determined with FFOCM cross sections. L, Stromal cell density calculated with IVCM images 3 months after injection. M,O, IVCM images of the stromal layer. Arrowheads show stromal striae in sham‐injected cornea (M). N,P, Normal endothelial appearance in sham‐ and MSSC‐injected corneas. Q,R, Collagen type III staining in both sham‐ and MSSC‐injected corneas. S,T, α‐SMA staining in both sham‐ and MSSC‐injected corneas. Scale bars = 100 μm. Errors bars = ±SEM; *P < .05; **P < .01. α‐SMA, alpha‐smooth muscle actin; FFOCM, full field optical coherence microscopy; MSSC, mouse stromal stem cell; IVCM, in vivo confocal microscopy
