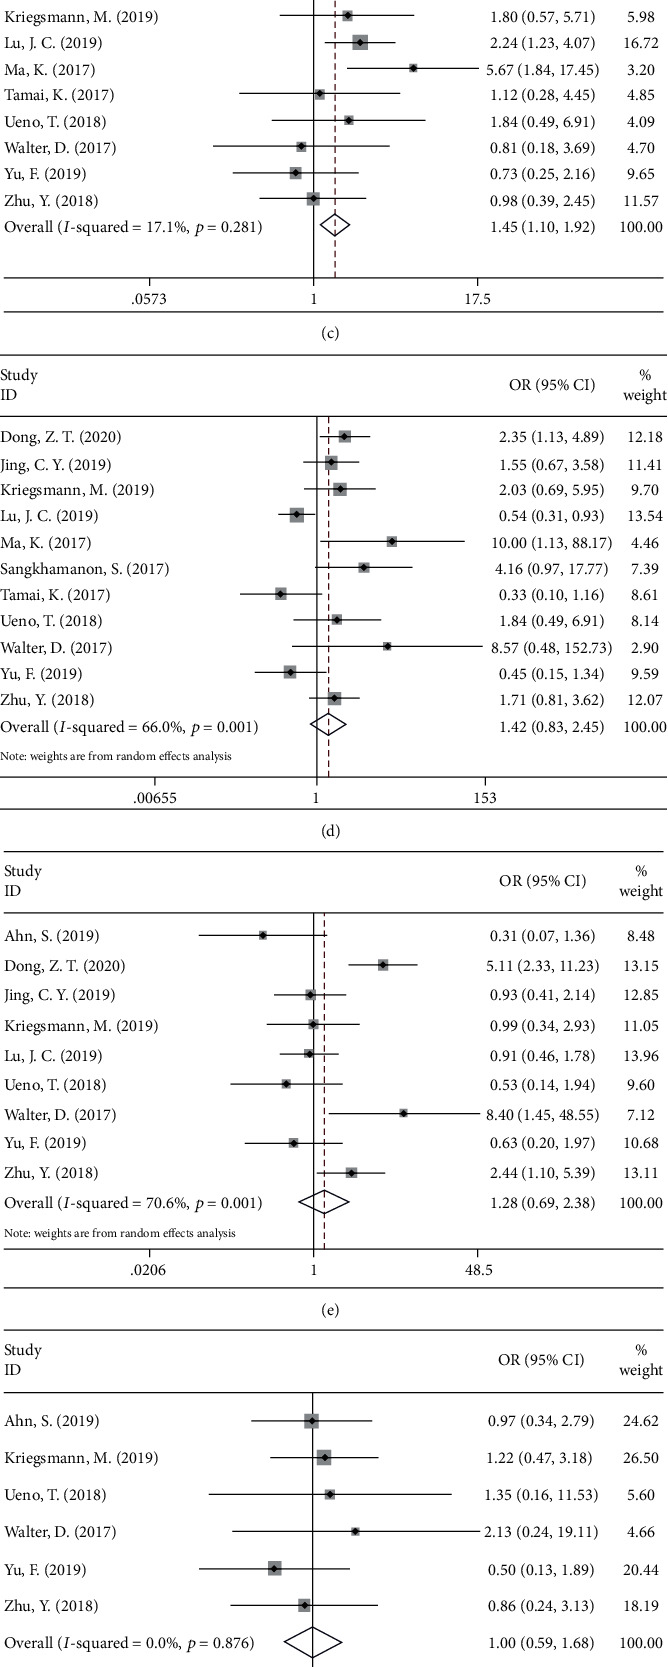
Figure 4.

Forest plots of ORs for the association between PD-L1 expression and (a) sex (male vs. female), (b) tumor differentiation (poor vs. well/moderate), (c) pN stage (III+IV vs. I+II), (d) TNM stage (III+IV vs. I+II), (e) vascular invasion (yes vs. no), (f) perineural invasion (yes vs. no), (g) age (>60 vs. ≤60), and (h) tumor size (>5 cm vs. ≤5 cm).
