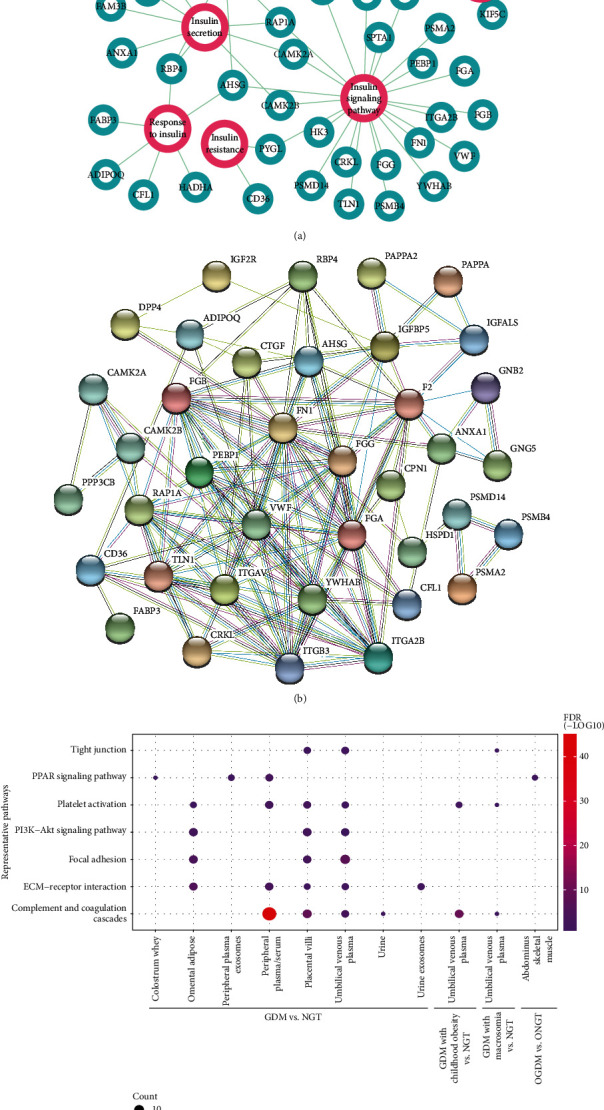
Figure 3.

Functional annotation of the integrated differentially expressed proteins. (a) Relation network of differentially expressed proteins and insulin functions; (b) protein-protein relation network of insulin-associated DE genes; (c) representative enriched pathways for different groups of DE genes. Circle size is proportional to the number of gene count, while graduated color indicates the corresponding value of FDR.
