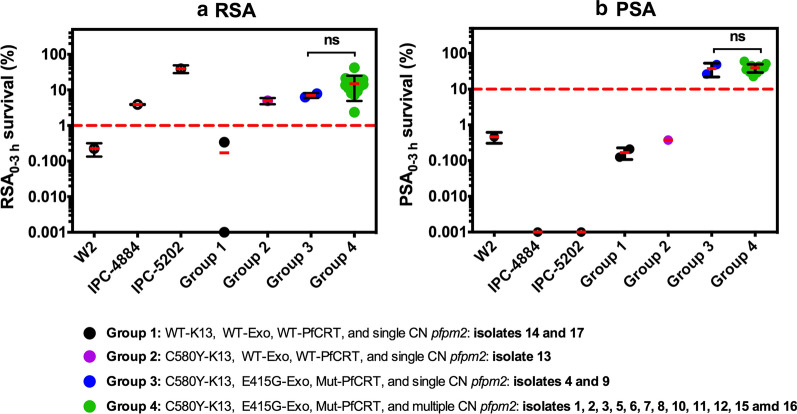
Fig. 1.
Survival assay for ART- and PPQ-resistance. a In vitro RSA0-3h survival rates for standard laboratory-adapted clones (W2 for an ART-sensitive control, IPC-4884 and IPC-5202 for ART-resistance control) and culture-adapted clinical isolates. The dashed line represents the 1% survival rate cut-off that differentiates ART-resistance (≥ 1%, red-dashed line) from ART-sensitive (< 1%) parasites in RSAs. b In vitro PPQ survival assay (PSA0–3 h) survival rates for standard laboratory-adapted clones (W2, IPC-4884 and IPC-5202 for PPQ-sensitive parasites) and culture-adapted clinical isolates. The dashed line represent the 10% survival rate cut-off that distinguishes PPQ-resistance (≥ 10%) from PPQ-sensitive (< 10%, red dashed line) parasites in PSAs. Two biological replicates were performed and survival rates are presented as mean ± S.D. Significance was determined using Mann–Whitney U test. Group 3 and Group 4 are compared. ns is not significant (p ≥ 0.05). Zero values of % survival rate were plotted as 0.001% in logarithmic scale

