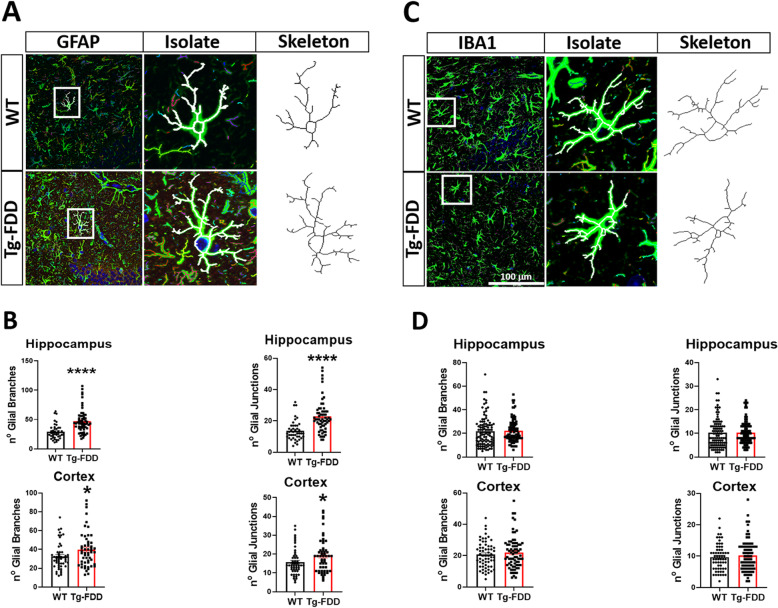
Fig. 2.
Glial morphometric changes in Tg-FDD mice. a Individual astrocytes (GFAP, green) were selected, isolated, thresholded, and skeletonized for analysis from brain sections of WT or Tg-FDD mice. b Quantification of individual astrocyte number of branches and junctions from the hippocampus and cortex. c Individual microglia (GFAP, green) were selected, isolated, thresholded, and skeletonized for analysis within cortex and hippocampus in brain sections of WT or Tg-FDD mice d Quantification of individual microglia number of branches and junctions from the hippocampus and cortex. a and c are representative images of the hippocampus of 9-month-old mice. Results are shown as the mean ± SEM of n = 4 per genotype and 10–30 astrocytes or microglia per animal, where *p < 0.05 and ****p < 0.0001 as determined by unpaired Student’s t test. Scale bar 100 μm

