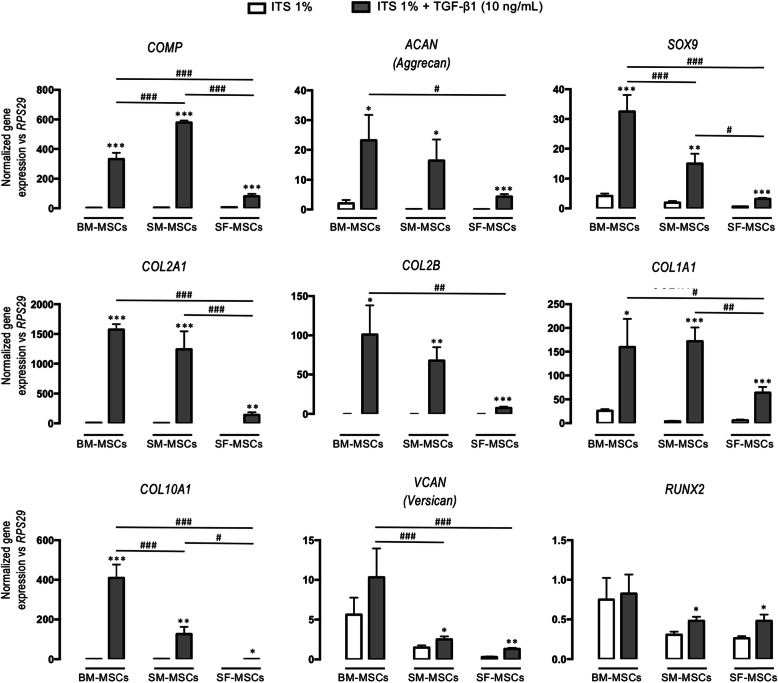
Fig. 2.
Gene expression at D28 in collagen sponges seeded with human BM-, SM-, and SF-MSCs under ITS and TGF-β1 conditions. Relative mRNA expression was measured by real-time polymerase chain reaction of chondrogenic (COMP, ACAN, SOX9, COL2A1, and COL2B), fibrotic (COL1A1 and VCAN), and hypertrophic (COL10A1 and RUNX2) markers. All results were normalized to RPS29 mRNA expression. Data are presented as the mean ± standard error of the mean. Statistical analysis was performed with a t test to evaluate the effect of TGF-β1 versus ITS for each cellular group separately and was followed by two-way ANOVA with Bonferroni’s post hoc test on all values to evaluate differences in gene expression between all cellular groups. Asterisks represent a significant difference versus control condition (ITS 1%); *p < 0.05, p < 0.01, ***p < 0.001. Hash signs represent a significant difference between cellular groups; #p < 0.05, ##p < 0.01, ###p < 0.001

