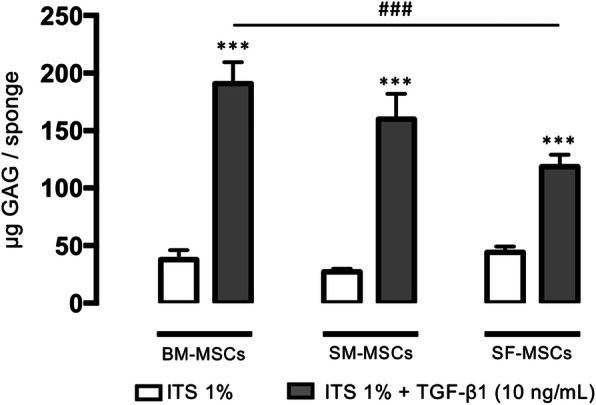
Fig. 3.

GAG content at D28 in collagen sponges seeded with advanced OA human BM-, SM-, and SF-MSCs under ITS and TGF-β1. The concentration of GAG in micrograms per sponge was measured with a dimethyl methylene blue colorimetric assay. Statistical analysis was performed with a t test to evaluate the effect of TGF-β1 versus ITS for each cellular group separately and followed by two-way ANOVA with Bonferroni’s post hoc test on all values to evaluate the difference in GAG production between all cellular groups. Asterisks represent a significant difference versus control condition (ITS 1%); ***p < 0.001. Hash signs represent a significant difference between cellular group; ###p < 0.001
