FIGURE 3.

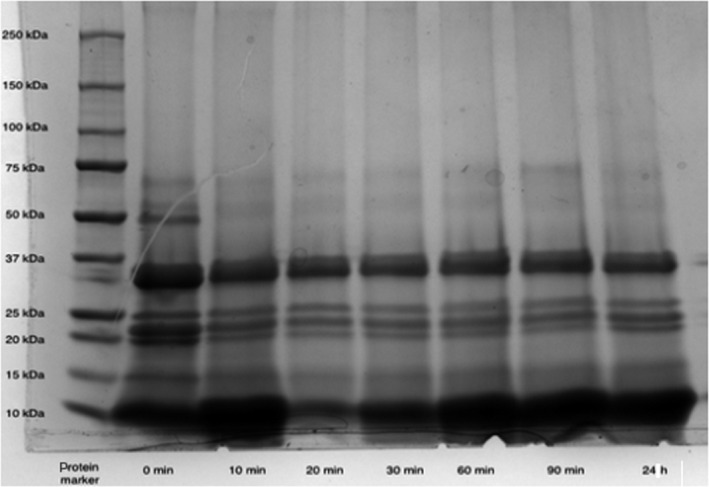
SDS‐PAGE patterns of butternut squash seed protein hydrolysate. Lane 1 shows molecular mass markers from top downward (250–10 kDa). Lanes 2 to 8 indicate electrophoretic mobility of squash seed extract hydrolyzed from 0 min to 24 hr

SDS‐PAGE patterns of butternut squash seed protein hydrolysate. Lane 1 shows molecular mass markers from top downward (250–10 kDa). Lanes 2 to 8 indicate electrophoretic mobility of squash seed extract hydrolyzed from 0 min to 24 hr