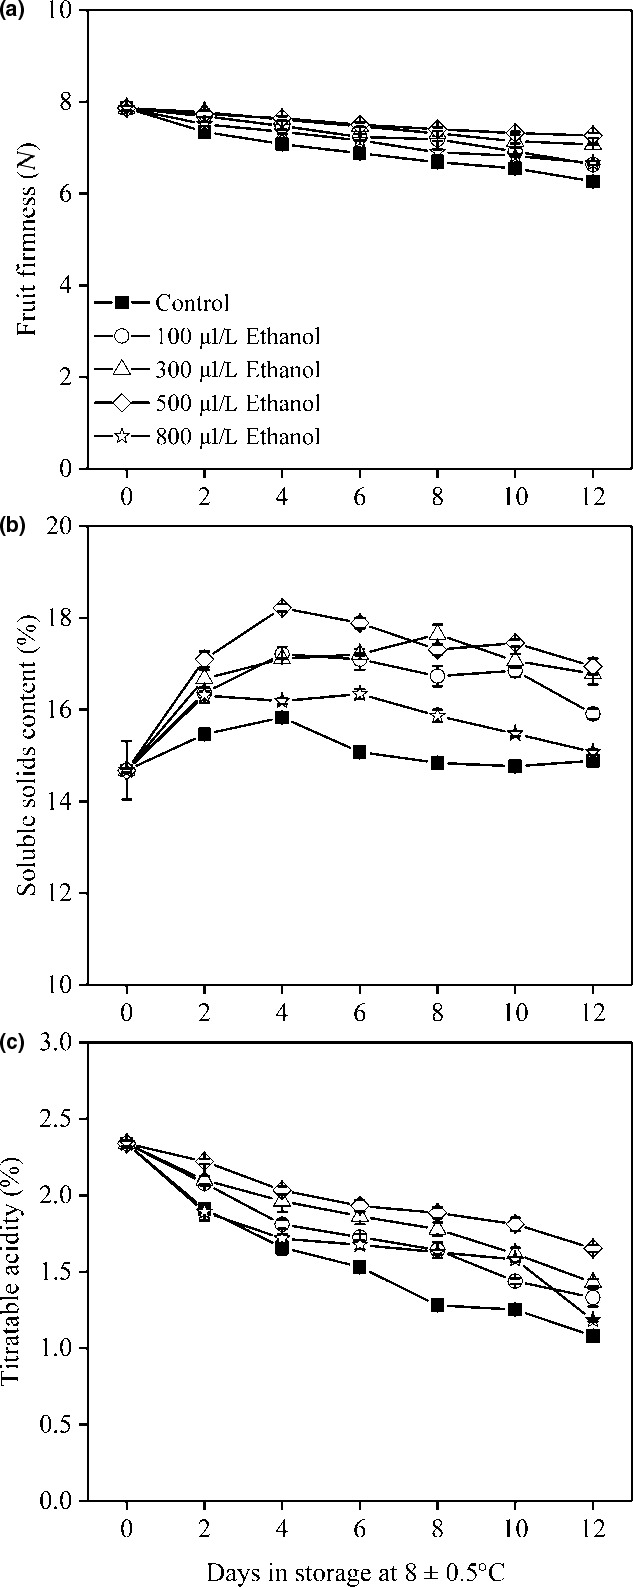
FIGURE 3.

Fruit FF (a), soluble solids content (b), and titratable acidity (c) of wampee fruit treated with 100, 300, 500, and 800 μl/L of ethanol stored at 8 ± 0.5°C. Values are the mean ± SD. Different letters indicate significant differences among treatments according to Duncan's multiple range test (p < .05)
