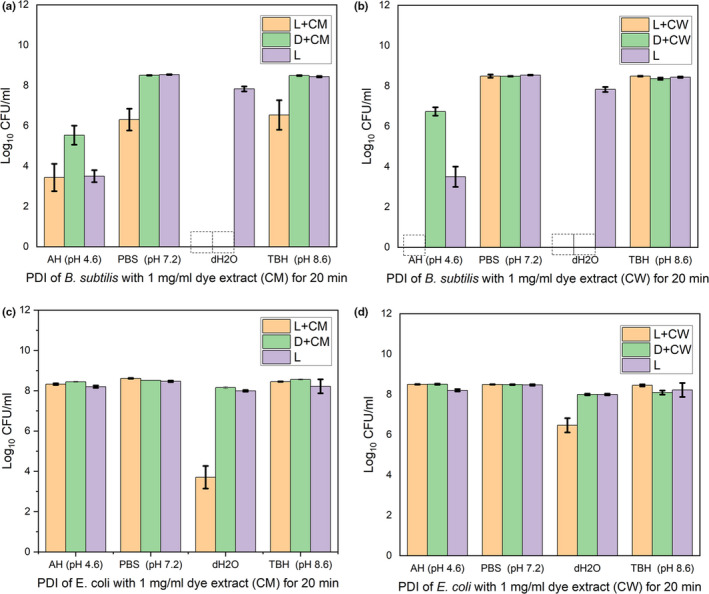
FIGURE 3.

PDI of model bacteria using the dye extracts (CM and CW) with different buffers/solutions, illumination at 10 mW/cm2 for 20 min. (a) and (b) are PDI of B. subtilis using dye extracts CM and CW, respectively. (c) and (d) are PDI of E. coli using dye extracts CM and CW, respectively. AH, acetate‐HCl buffer; CM, cold methanol dye extract; CW, cold distilled water dye extract; dH2O, distilled water; PBS, phosphate buffer saline; TBH, Tris base‐HCl buffer; L+CM and L+CW are light experiments (dye extracts with light illumination); D+CM and D+CW are dark control experiments (dye extracts without light illumination); and L are “light only” control experiments (no dye extracts but illuminated with light). Data are mean ± SD (n = 3). Error bars show ±SD.  , Complete inactivation
