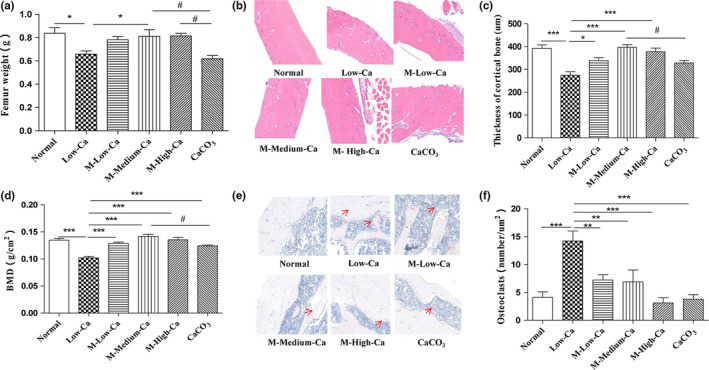
FIGURE 5.

Femur features. Wet weight of the femur in each group (a), bone mineral density (BMD) (b). Cortical bone tissue was stained with hematoxylin and eosin (H&E) (c), and cortical bone thickness (d) was calculated. Osteoclasts were stained with Trap (e), and the number of osteoclasts (f) was calculated. A representative image was acquired using a medical image analysis system, and the original magnification was ×200. All data are expressed as mean ± SEM (n = 10). *p < .05 and **p < .01 compared with calcium‐deficient group. #p < .05 and ##p < .01 compared with CaCO3 group
