
FIGURE 2.
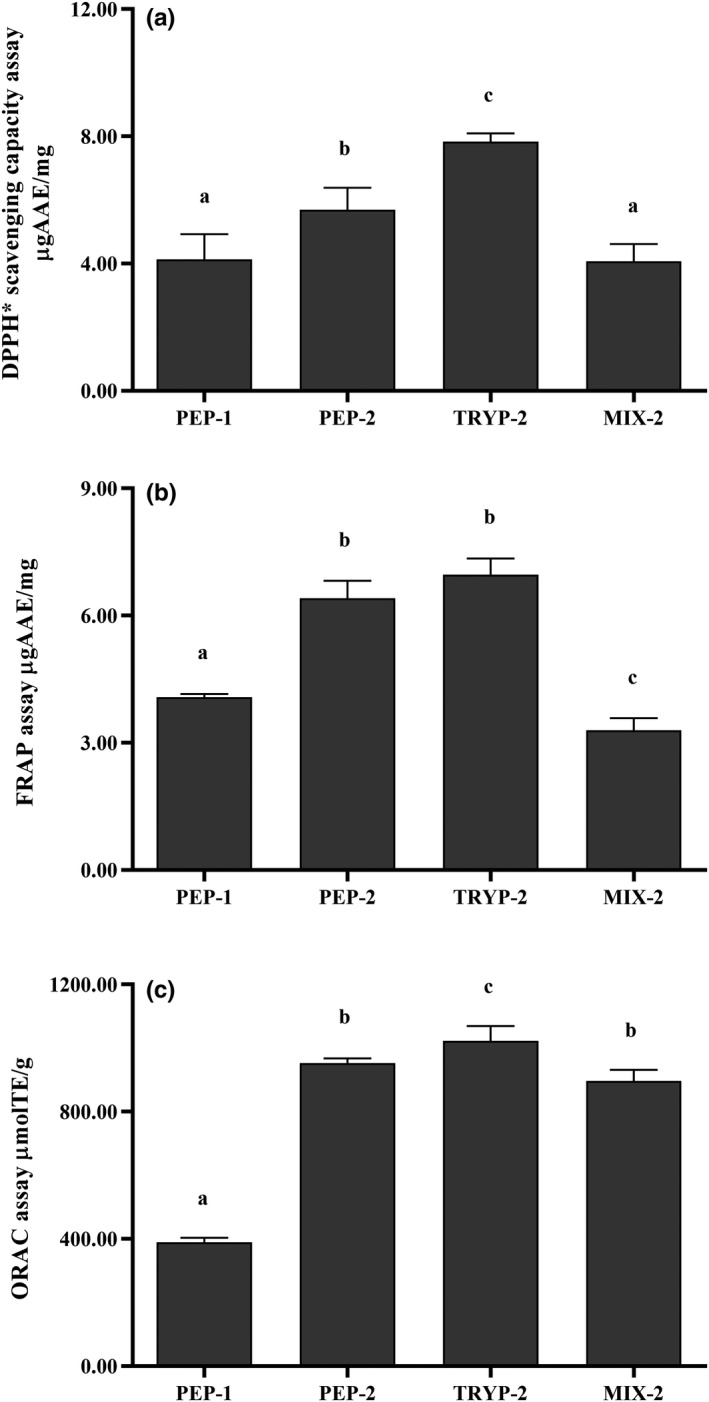
Antioxidant capacity assay of the bioactive peptide fractions (PEP‐1, PEP‐2, TRYP‐2 and MIX‐2). (a) DPPH scavenging capacity assay. (b) Ferric Reducing Antioxidant Power (FRAP) assay. (c) Oxygen radical absorbing capacity assay. Results are expressed as micromoles of Ascorbic acid equivalents (AAE) or Trolox equivalents (TE) per milligram of the bioactive peptides fractions. All tests were conducted in triplicate, and mean values are used. The vertical bars represent the standard deviation of each data point. Values marked by the same letter are not significantly different (p > .05)