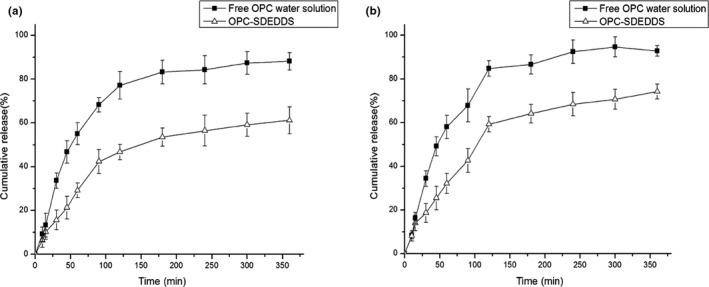
FIGURE 8.

Cumulative amount of OPC released from SDEDDS and water solution in (a) simulated gastric fluid and (b) simulated intestinal fluid over a period of 6 hr. Values are expressed as mean ± SD (n = 3)

Cumulative amount of OPC released from SDEDDS and water solution in (a) simulated gastric fluid and (b) simulated intestinal fluid over a period of 6 hr. Values are expressed as mean ± SD (n = 3)