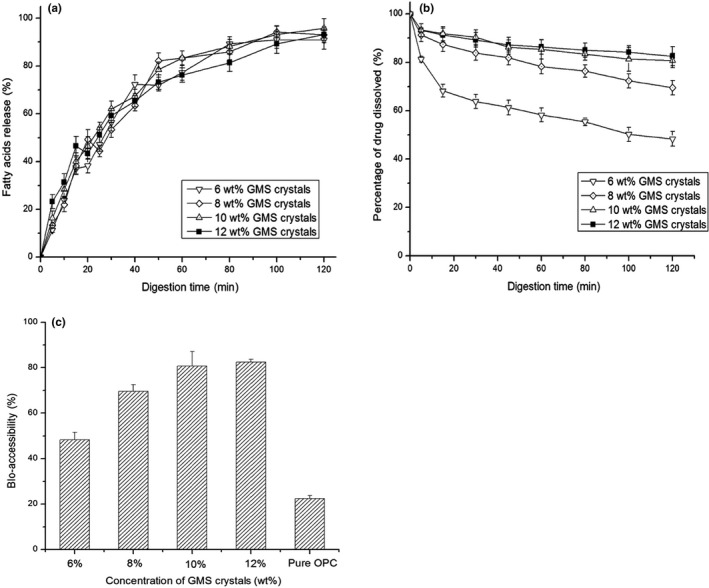
FIGURE 9.

(a) Amount of fatty acids released from OPC‐SDEDDS containing different GMS crystal concentrations as determines using a pH‐stat titration technique. (b) Percentage of OPC that remains dissolved after the digestion of the OPC‐SDEDDS containing different GMS crystal concentrations in SIF. (c) Bioaccessibility of the OPC‐SDEDDS containing different GMS crystal concentrations and the pure OPC powder. Values are expressed as mean ± SD (n = 3)
