Fig. 1.
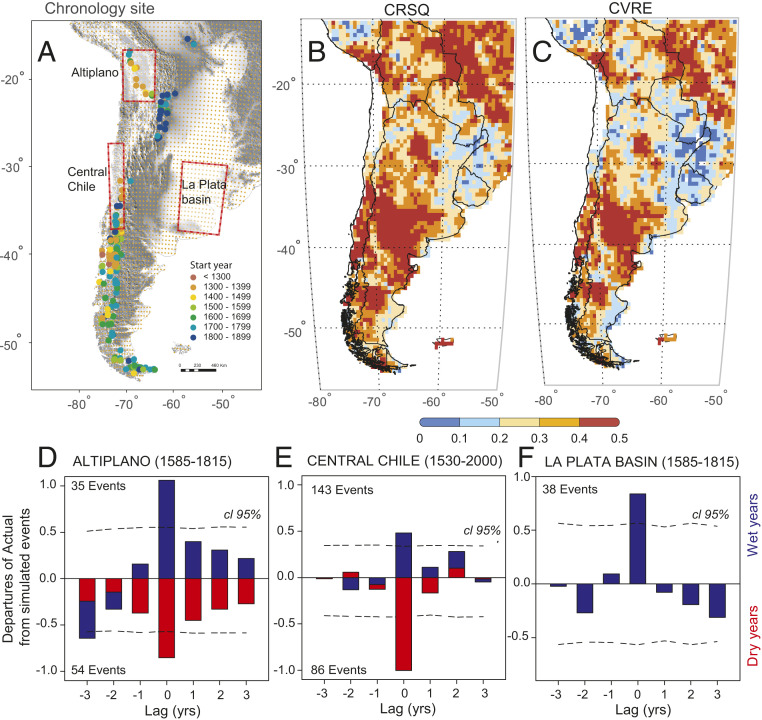
SADA domain and verifications based on instrumental climate and historical documents. (A) Map of the DJF scPDSI target field (small orange dots mark grid-point centers) and the network of 286 tree ring chronologies used for reconstruction (circles colored to indicate start year). (B) Calibration-period regression coefficient of determination (CRSQ); the white region over northern Chile indicates where the reconstruction was not performed. (C) Calibration period leave-one-out cross-validation reduction of error (CVRE). (D–F) Superposed epoch analyses (SEAs) for reconstructed scPDSI (red rectangles in map) during the dry/wet events recorded by historical documents from (D) Potosí, Bolivia (1585 to 1807), (E) central Chile (1530 to 2000), and (F) Santa Fe city (1585 to 1815; La Plata basin). The red/blue bars represent scPDSI departure from normal conditions for a 9-y window (t − 4 to t + 4) based on 1,000 Monte Carlo simulations for the dry/wet historical events, respectively. The short dashed lines represent the 95% confidence limits.

