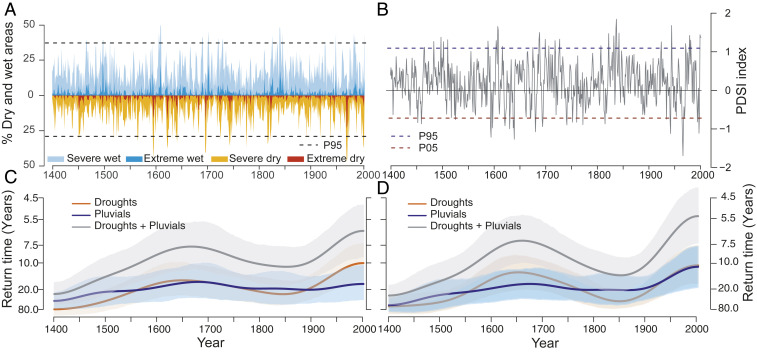
Fig. 2.
Spatial magnitude and frequency of extreme drought and pluvial events in the SADA domain. (A) Percentage of area under severely dry (scPDSI −2, orange) and extremely dry (scPDSI −4, red) conditions, and for severely wet (scPDSI +2, light blue) and extremely wet (scPDSI +4, blue) conditions. The black short dashed lines indicate 95% percentiles of the distribution, from which severe widespread dry/wet events were selected for the return time analysis in C. (B) Average of SADA reconstructions over the entire study domain. The red and blue short dashed lines indicate the 5% and 95% percentiles of the distribution, respectively, from which extreme drought/wet events were selected for the return time analysis in D. (C and D) Time-varying frequency of the occurrences of severe widespread dry/wet scPDSI events and extreme dry/wet scPDSI events, respectively, between 1400 and 2000. A kernel smoothing method was used with a bandwidth of 50 y (49). The shaded areas (gray, blue, and orange) represent 95% confidence intervals based on 1,000 bootstrap simulations.

