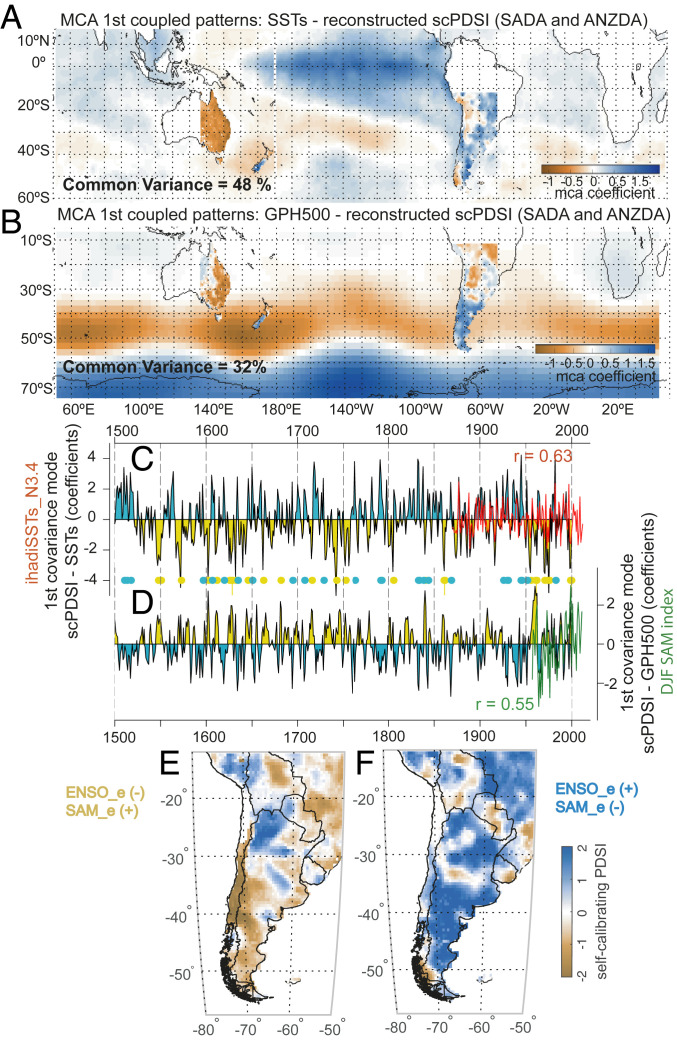
Fig. 4.
Major SH forcing of hydroclimate variability and impacts on SADA composite maps. (A) Coupled spatial patterns of the leading MCA mode between SADA–ANZDA scPDSI and austral summer SSTs over the common period 1901 to 2000. (B) Coupled spatial patterns of the leading MCA mode between SADA–ANZDA scPDSI and austral summer geopotential height (500 hpa) over the common period 1948 to 2015. Temporal variability of the scPDSI leading modes for (C) ENSO and (D) SAM, resulting from the MCA analysis of A and B. Pearson’s correlation coefficients (r) between the ENSO-e and SAM-e modes (black lines) and the DJF_NINO3.4 (red line) and SAM_DJF (green line) indices are given in red and green text in C and D, respectively. The yellow (light blue) dots indicate simultaneously anomalous negative (positive) ENSO-e and positive (negative) SAM-e index values from the MCA estimates. Composite SADA maps of the (E) 25 events of simultaneously anomalous negative ENSO-e and positive SAM-e years, and the (F) 26 events of simultaneously anomalous positive ENSO-e and negative SAM-e years.

