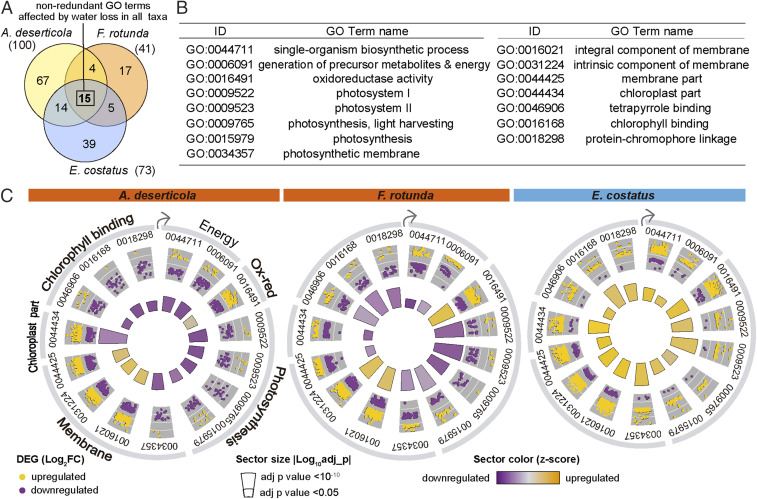
Fig. 2.
Contrasting response of functions identified by GO analysis, during desiccation. (A) Venn diagram showing the overlap of GO terms (after filtering for redundancy) that were enriched in DEGs identified during Late and Dry stages in desert-evolved (A. deserticola and F. rotunda) and aquatic taxa (E. costatus). The number between parentheses is the total number of enriched GO terms. (B) Identity of the 15 GO terms enriched in DEGs in all species, during desiccation. (C) Polar graphs indicating the direction of response of enriched GO terms in each species. The outer ring shows the Log2FC (calculated with DESeq2 (46)) of each DEG annotated within the GO category (up-regulated colored gold, down-regulated colored purple, Datasets S3–S5). In the inner ring, the size of each sector is proportional to the statistical significance of the term (quantified as the adjusted P value) from the GO enrichment analysis in GOseq (47). The color indicates the overall behavior of the GO term based on the value of its z score, calculated using GOplot (49). Up-regulated terms are indicated in gold, down-regulated in purple.

