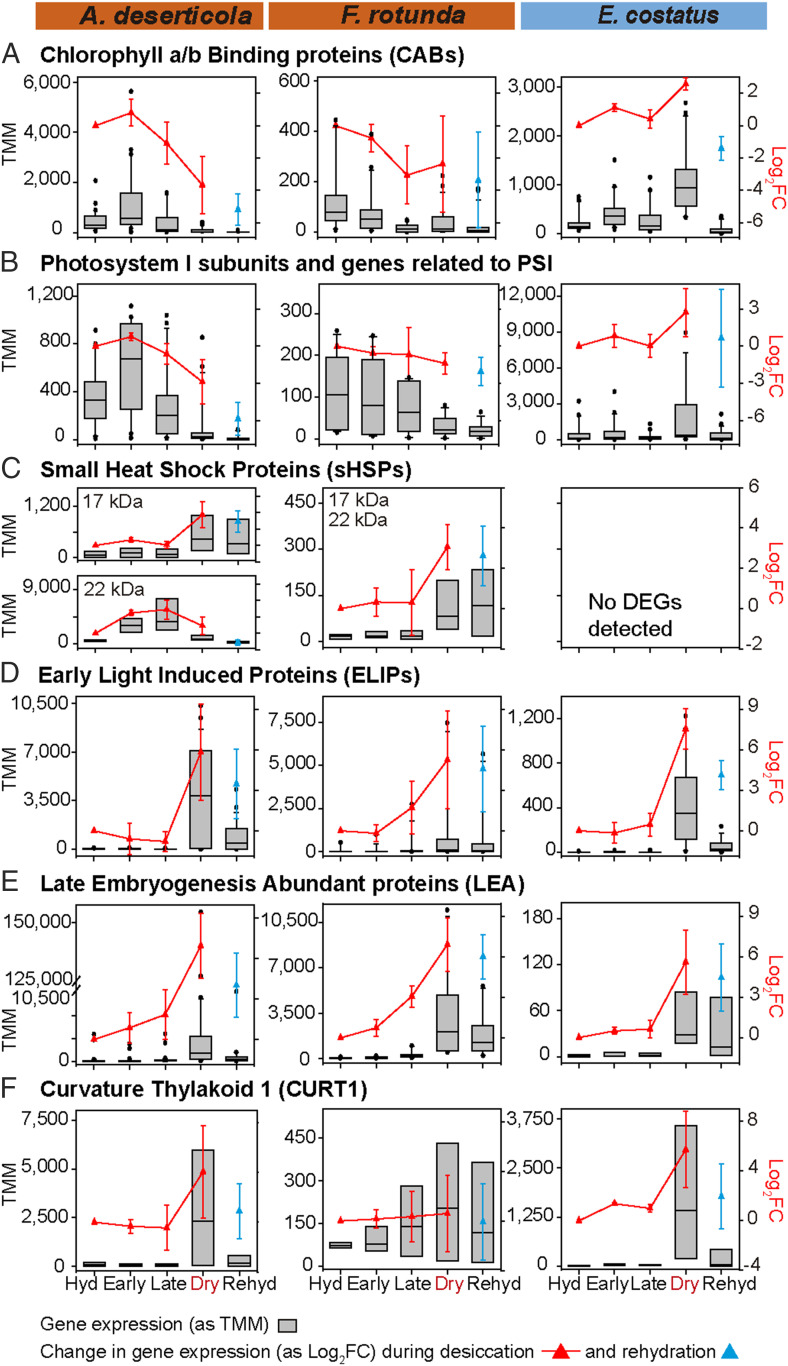
Fig. 3.
Expression patterns of genes traditionally associated with desiccation tolerance during desiccation and rehydration. (A–F) Each panel presents normalized expression data (as standardized trimmed mean of M-values, TMM) for all DEGs annotated using nr NCBI and/or Uniprot90-SwissProt databases as members of the given gene family (Dataset S7). Box plots summarize the expression of the category in each stage of the desiccation rehydration time course. In the graphs, the boundaries of the boxes indicate the lower and upper quartiles, a black line within each box marks the median, and the whiskers above and below the box indicate the 5th and 95th percentiles. Black points above and below the whiskers indicate outliers outside that range. Average changes in expression of all DEGs within the category during the desiccation time course are indicated with a red line (as Log2FC ± SD). Changes during rehydration are indicated in blue (as Log2FC ± SD). For each gene family, the right-hand y axis Log2FC scale is identical across all species.

