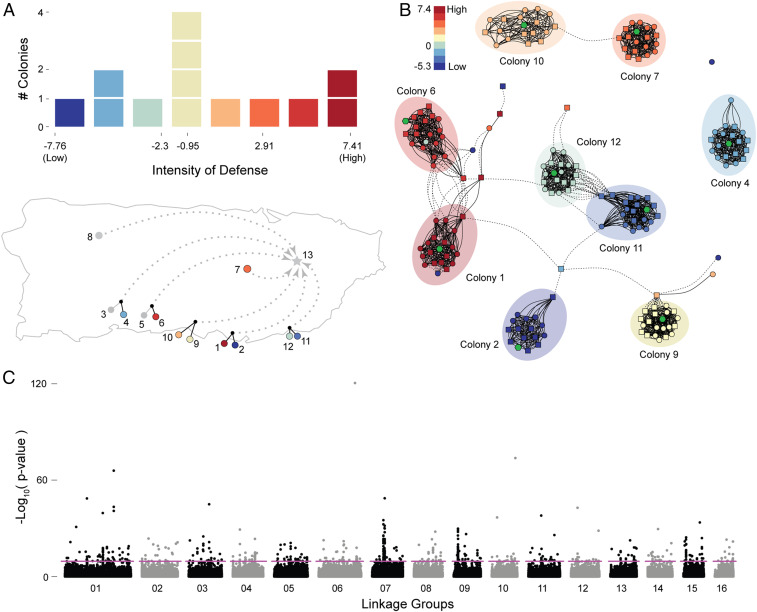
Fig. 1.
Genome-wide associations of aggression at the group level. (A) Distribution of colony aggression phenotypes derived using dimensional reduction of response to experimental threat and postthreat behavioral screening assay for all colonies used in the study; the map illustrates the original geographic source for all of the colonies, with colors highlighting intensity of response or exclusion (if gray). (B) Network diagram of kinship structure derived from a sparse matrix of coefficient of relationships (r) retaining only the degrees of relationship above first cousin (0.125). Circle vertices identify foragers, square vertices identify soldiers, and color of vertices matches colony response from A. Green hexagons identify queen samples, and edges highlight kinship associations within (solid) and between (dotted) colonies. Grouping was achieved with the Fruchterman–Reingold algorithm. (C) Association of colony-level MAF across the genome to colony aggression phenotype; the dashed line shows significance threshold (Bonferroni corrected α = 7.67E−10).

