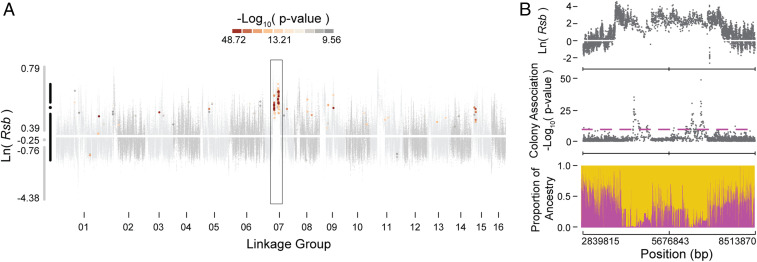
Fig. 2.
Signatures of selection and admixture in loci associated with colony aggression. (A) Gray dots show selection signatures [the natural log ratio of decay in LD, ln(Rsb)] across the genome for variants between gAHBs and AHBs (data from ref. 21). Those that show both statistically significant selection and statistically significant association between colony-level genotype and colony aggression phenotype in the present study are colored according to significance of the group genotype–phenotype association. The association and selection studies used different samples of individuals. Adjacent to the y axis, simplified box plots for all of the haplotype blocks (gray) and those with overlap (black) identify the extremes, interquartile range, and median of the ln(Rsb) distribution. The dark rectangle highlights a span of notable, significant overlap in LG 07. (B) Region within the rectangle of A, expanded to show selection, association, and admixture. (Top) The ln(Rsb) signal from Fig. 2A. (Middle) The colony genome-wide association signal from Fig. 1C. (Bottom) The proportional contribution of EHB (yellow) and AHB (magenta) reference populations from ref. 14. Proportional contribution was derived via RFMix ancestry determination analysis and ranges from zero to one (y axis). The x axes for all three plots correspond to base pair coordinates of the span within LG 07.

