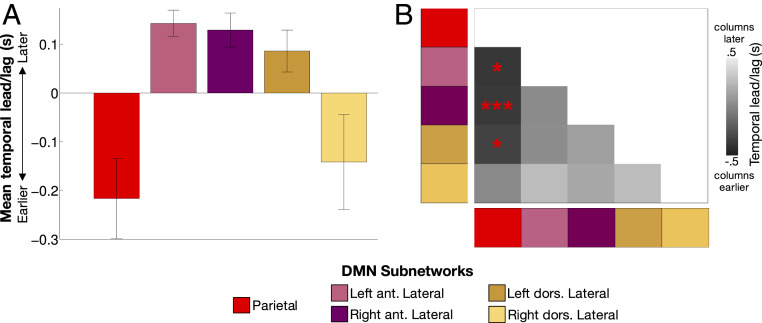
Fig. 6.
BOLD signals in Lateral DMN subnetworks are delayed relative to those in the Parietal subnetwork. (A) Average temporal ordering of signals in each subnetwork relative to other subnetworks. Error bars indicate SEs across subjects. (B) TD matrix indicating relative lead/lag of each network pairing. Dark colors indicate the “column” subnetwork is earlier; light colors indicate the “row” subnetwork is earlier. *P < 0.05 corrected; ***P < 0.001 corrected. ant., anterior; dors., dorsal.

