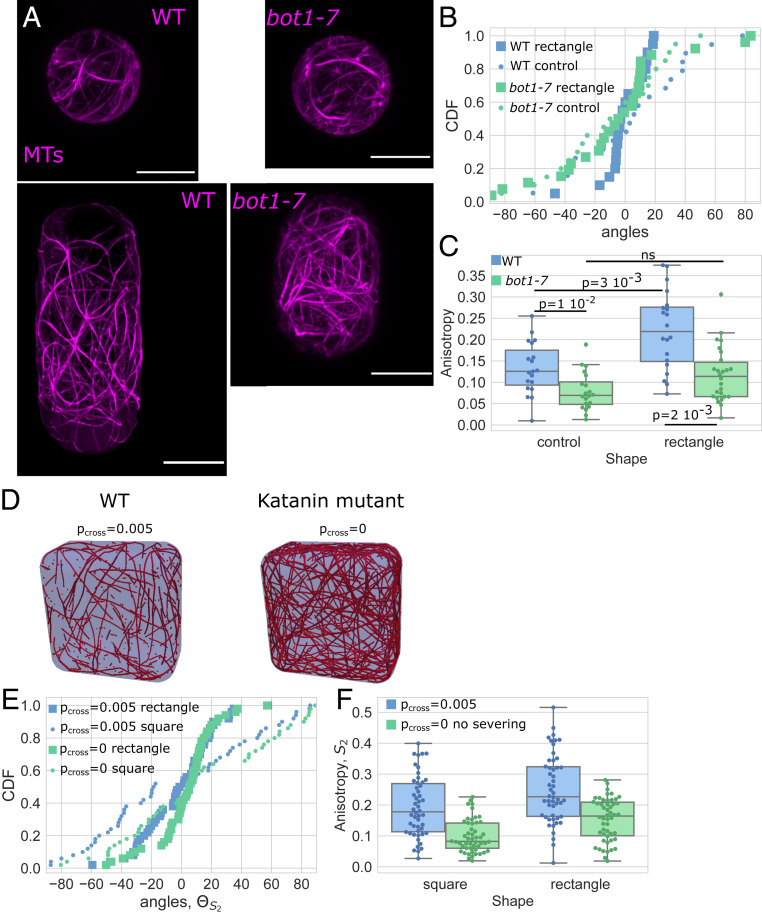
Fig. 4.
Shape response in protoplasts with genetically disturbed MTs dynamics. (A) Protoplasts expressing MBD-GFP reporter confined in microwells showing the effect of shape on the MT network organization in wild-type protoplasts (Left) and protoplasts generated from calli in the bot1-7 mutation background (Right). All size standards are 10 µm. (B) Cumulative distributions of the average angle of the MT network of wild-type (blue) and bot1-7 (green) protoplasts in rectangular microwells (square markers) and in control-shaped (circle markers). Number of protoplasts N = 19 and number of repeats n = 3 for wild-type protoplasts in control shapes, N = 20 and n = 3 for wild-type protoplasts in rectangular shapes, N = 20 and n = 1 for bot1-7 protoplasts in control shapes, and N = 26 and n = 1 for bot1-7 protoplasts in rectangular shapes. (C) Boxplot comparing the anisotropy of the MT networks of wild-type (blue) and bot1-7 (green) protoplasts. The number of protoplasts N and number of repeats n are the same as in B. (D) Example of the MT arrangement from numerical simulations with (Left) and without (Right) crossover severing. (E) Graph of the average angle of the MT network for rectangular and square shapes in numerical simulations of tsteps = 3,000 time steps with (Pcross = 0.005) and without (Pcross = 0) crossover severing for each case averaged over R = 50 simulations. (F) Anisotropy of the MT network for rectangular and square shapes in numerical simulations of tsteps = 3,000 time steps with (Pcross = 0.005) and without (Pcross = 0) crossover severing for each case averaged over R = 50 simulations.

