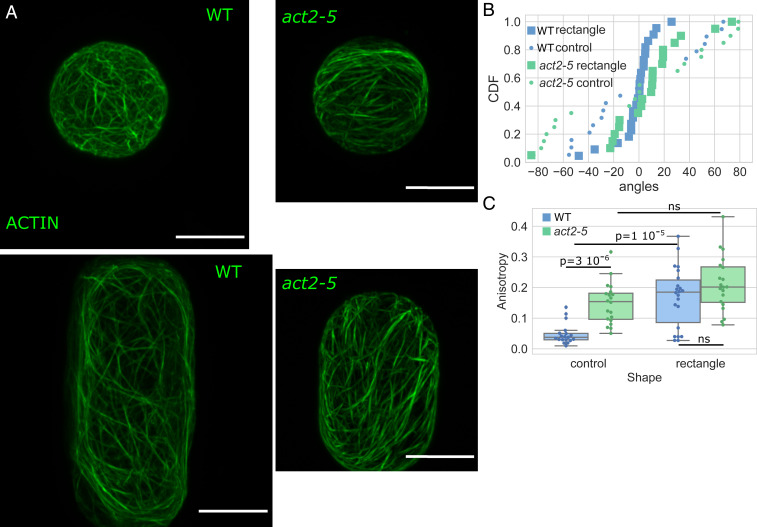
Fig. 5.
Shape response in protoplasts with genetically disturbed actin dynamics. (A) Protoplasts expressing FABD-GFP reporter confined in microwells showing the effect of shape on the actin network organization in wild-type protoplasts (Left) and protoplasts generated from calli in the act2-5 mutation background (Right). All size standards are 10 µm. (B) Cumulative distributions of the average angle of the actin networks of wild-type (blue) and act2-5 (green) protoplasts in rectangular microwells (square markers) and in control shape (circle markers). Number of protoplasts N = 19 and number of repeat n = 1 for wild-type protoplasts in control shapes, N = 22 and n = 4 for wild-type protoplasts in rectangular shapes, N = 20 and n = 2 for act2-5 protoplasts in control shapes, and N = 20 and n = 2 for act2-5 protoplasts in rectangular shapes. (C) Boxplot comparing the anisotropy of the actin networks of wild-type (blue) and act2-5 (green) protoplasts. The number of protoplasts N and number of repeats n are the same as in B.

