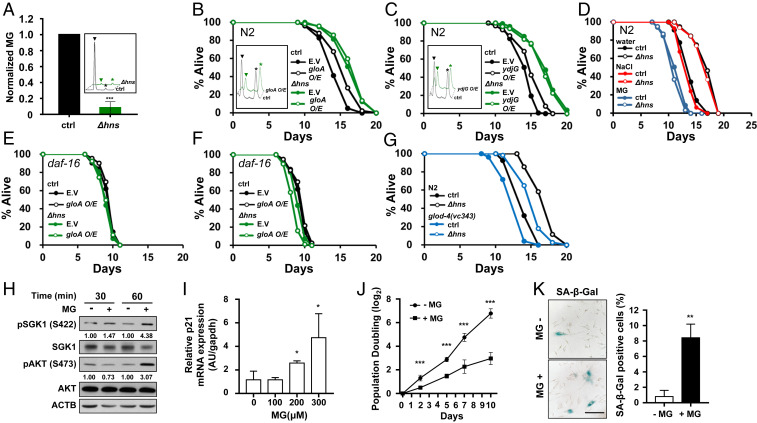
Fig. 5.
Bacteria-derived metabolite MG modulates host longevity. (A) MG was measured using HPLC. MG was barely detected in Δhns E. coli. Error bars indicate SEM from three independent experiments. Inside the box, black represents control E. coli and green represents Δhns. ▼ indicates MG; * indicates the internal standard, 5-methylquinoxaline (5-MQ). (B and C) Overexpression of MG-degrading enzymes gloA (B) or ydjG (C) extended the C. elegans lifespan in wild-type control E. coli but not in Δhns E. coli. Inside the box, black represents control and green represents overexpression of E. coli. MG level was reduced by 25% on overexpression of gloA (B) and by 51% on overexpression of ydjG (C). One of two independent assays is shown. (D) MG supplementation (20 mM) abolished the lifespan extension by Δhns E. coli. NaCl (20 mM) was used as an equivalent osmolarity control in the lifespan assays. One of three independent lifespan assays is shown. (E and F) The daf-16(mgDf50) mutation abolished the lifespan extension by the overexpression of gloA (E) and ydjG (F). (G) The Δhns mutation did not fully restore the shortened lifespan of glod-4(gk189) mutants (blue open circle) to that of N2 (black open circle). (H) MG enhanced the phosphorylation of SGK1 and AKT at HM. Immunoblot analysis was performed to detect the indicated proteins in HDF cells treated with (+) or without (−) MG (300 μM). The pSGK1/SGK1 and pAKT/AKT ratios are presented to allow for quantitative comparisons. Expression levels were quantified using ImageJ software with ACTB as a loading control. (I) Relative mRNA expression of p21 in HDF cells treated with MG (100 to 300 μM). p21 expression was normalized to expression of Gapdh. (J) The average rate of population doubling was determined by plating 5 × 10⁵ cells in duplicate and counting the number of HDF cells every 3–4 d. (K, Left) Representative differential interference contrast images of HDF cells stained for SA-β-Gal. (K, Right) quantification of SA-β-Gal–positive cells. Results represent the average of three independent staining experiments. HDF cells were treated with (+) or without (−) MG (300 μM). (Scale bar: 200 μm.) *P < 0.05; **P < 0.01; ***P < 0.001, Student’s t test.

