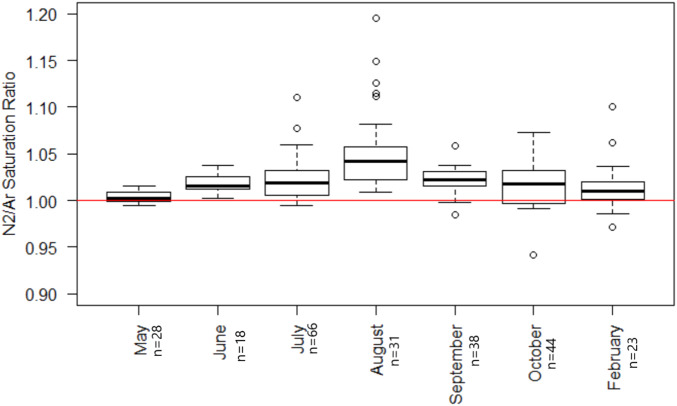
Fig. 3.
N2/Ar saturation ratios by month. The y axis shows N2/Ar saturation ratios. The red line denotes the saturation ratio of the gases given physical mixing properties. The sample sizes for each month are next to the month label. October samples were from 2016; every other month samples were from 2017. Not every lake was sampled every month that is represented on this graph. This graph contains all of the data collected.

