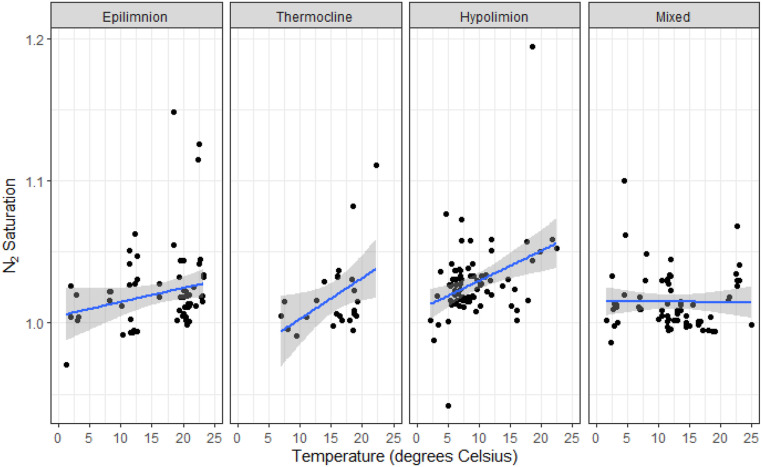
Fig. 5.
N2/Ar saturation ratios in relation to temperature and depth. The top axis breaks the data into distinct mixing layers based on stratification patterns. The epilimnion represents the mixing layer at the atmosphere-water interface. The thermocline is a temperature transition area from warm surface waters to cooler bottom waters. The hypolimnion is the lowest layer that interacts with lake sediments. Mixed represents lakes that were unstratified. The lines indicate individual linear regression trends per layer. Temperature was a significant variable in the epilimnion, thermocline, and hypolimnion (P < 0.01) and not significant trend in mixed lakes.

