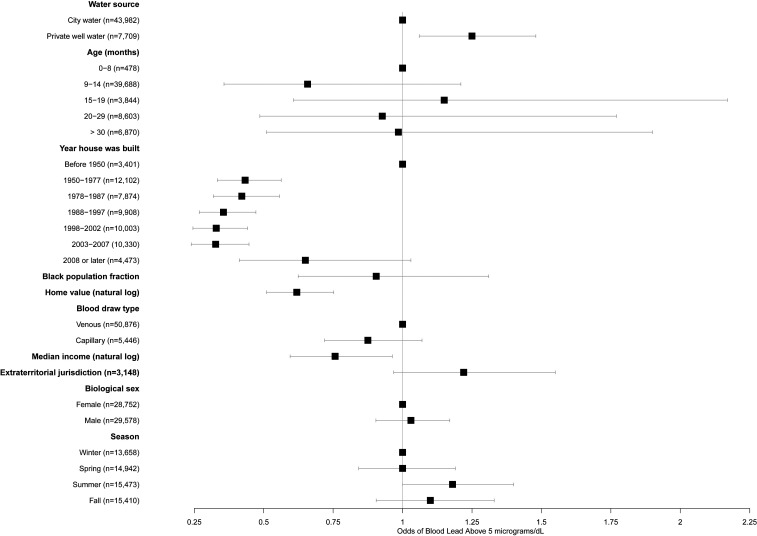
Fig. 5.
Odds of a child’s blood lead exceeding the Centers for Disease Control and Prevention 5 µg/dL threshold for elevated blood lead for different risk factors. Risk increases to the right of the line at x = 1 and decreases to the left of this line. Values reflect adjustment for all variables shown and for year of blood test. Error bars represent 95% confidence intervals.

