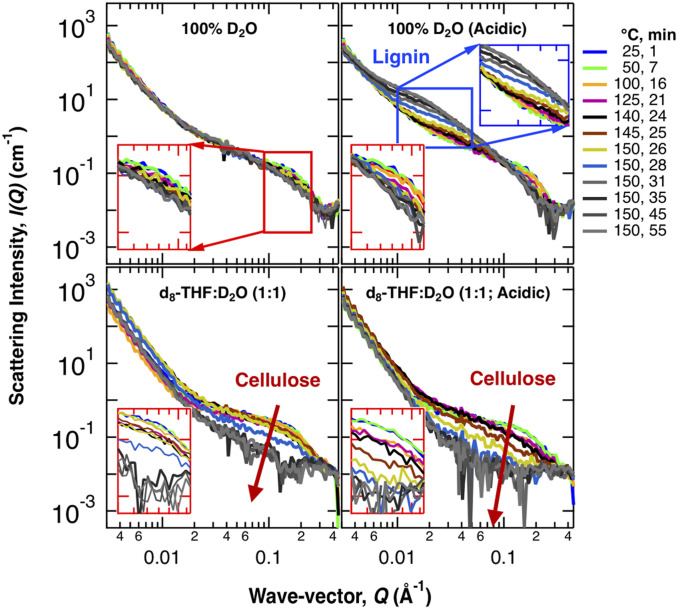
Fig. 1.
In situ SANS profiles of poplar wood subjected to different solvent pretreatments. SANS data collected while a poplar wood chip was pretreated. The temperature of the reaction cell was increased at a rate of 5 °C/min to 150 °C and held at this temperature for 30 min. The colors indicate the temperature of the reaction cell and the time passed since pretreatment begun. Arrows indicate changes in the SANS profiles associated with the cellulose and lignin. (Insets) I(Q) at relevant Q ranges: red boxes zoom-in the high-Q region associated with cellulose, while blue boxes zoom-in the mid-Q region associated with lignin.

