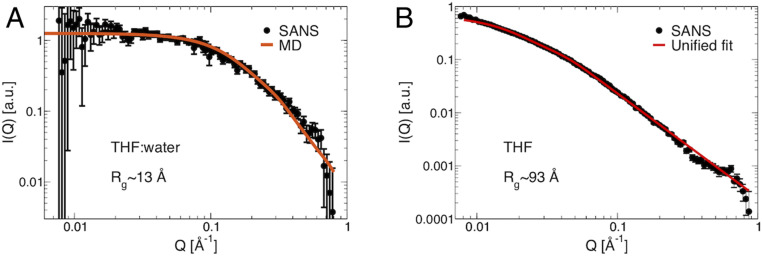
Fig. 3.
SANS and MD simulations of lignin in THF:water cosolvent and in pure THF. SANS of acetylated lignin (10 mg/mL) extracted from poplar in A. A cosolvent of d8-THF:D2O (1:1 v:v), black dots are the experimental data and the red line the MD simulation. The simulation-derived intensities have been scaled by a constant factor to match experiments at low Q. (B) d8-THF, black dots are experimental data and the red line is a unified fit (SI Appendix, Eq. S2). See also SI Appendix, Fig. S3. All data were collected at 25 °C.

