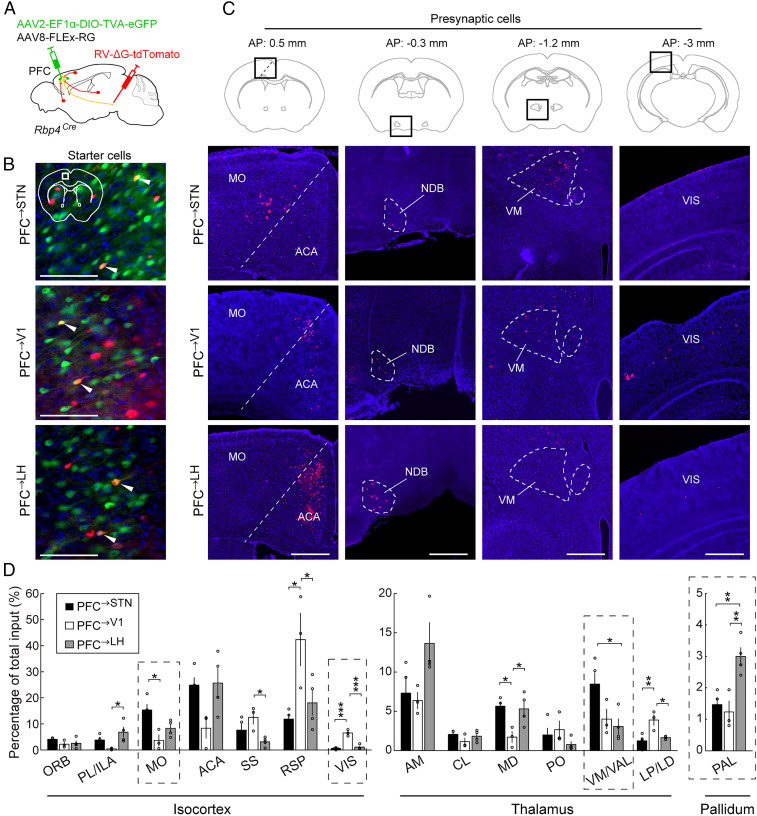
Fig. 4.
Inputs to PFC→STN, PFC→V1, and PFC→LH neurons. (A) Schematic for RV-mediated transsynaptic retrograde tracing. (B) Fluorescence images of starter cells in dmPFC (white box in coronal diagram). Red, RV-tdTomato; green, TVA-eGFP; blue, DAPI. White arrowheads indicate starter cells expressing both RV-tdTomato and TVA-eGFP. (Scale bar, 100 µm.) (C) Fluorescence images of presynaptic cells in several brain regions (black boxes in coronal diagrams). Red, RV-tdTomato; blue, DAPI. MO, somatomotor areas; ACA, anterior cingulate area; NDB, diagonal band nucleus; VM, ventral medial nucleus of the thalamus; VIS, visual cortical area. (Scale bar, 500 µm.) (D) Percentages of total presynaptic inputs (PFC→STN, n = 4 mice; PFC→V1, n = 3 mice; PFC→LH, n = 4 mice; *P < 0.05; **P < 0.01, ***P < 0.001, one-way ANOVA, Tukey’s post hoc test). Only regions with >2% inputs to at least one of the three populations are shown. Dashed boxes indicate regions shown in C. ORB, orbital area; PL, prelimbic area; ILA, infralimbic area; SS, somatosensory areas; RSP, retrosplenial area; AM, anteromedial nucleus of the thalamus; CL, central lateral nucleus of the thalamus; MD, mediodorsal nucleus of the thalamus; PO, posterior complex of the thalamus; VAL, ventral anterior-lateral complex of the thalamus; LP, lateral posterior nucleus of the thalamus; LD, lateral dorsal nucleus of the thalamus. Error bars indicate ±SEM.

