Fig. 6.
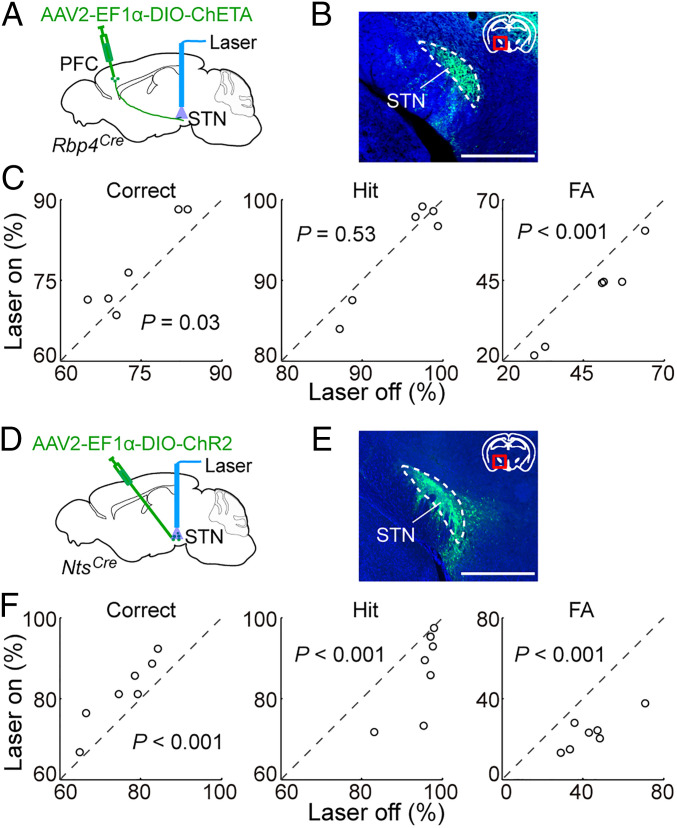
Effects of activating PFC→STN axons or STN neurons. (A) Schematic of optogenetic activation of dmPFC axon terminals in STN. (B) Fluorescence image showing ChETA-eYFP expressing dmPFC axons in STN. Green, ChETA-eYFP; blue, DAPI. (Scale bar, 1 mm.) (C) Activation of dmPFC axon terminals in STN (50 Hz) caused a significant improvement in task performance by reducing the FA rate (correct rate, P = 0.03; hit rate, P = 0.53; FA rate, P < 0.001; bootstrap, n = 6 mice). (D) Schematic of optogenetic activation of STN cells. (E) Fluorescence image showing ChR2-eYFP expression in STN neurons. Green, ChR2-eYFP; blue, DAPI. (Scale bar, 1 mm.) (F) Activation of STN cell (10 Hz) caused a significant improvement in task performance (correct, hit, and FA rates are all P < 0.001; bootstrap, n = 7 mice).

