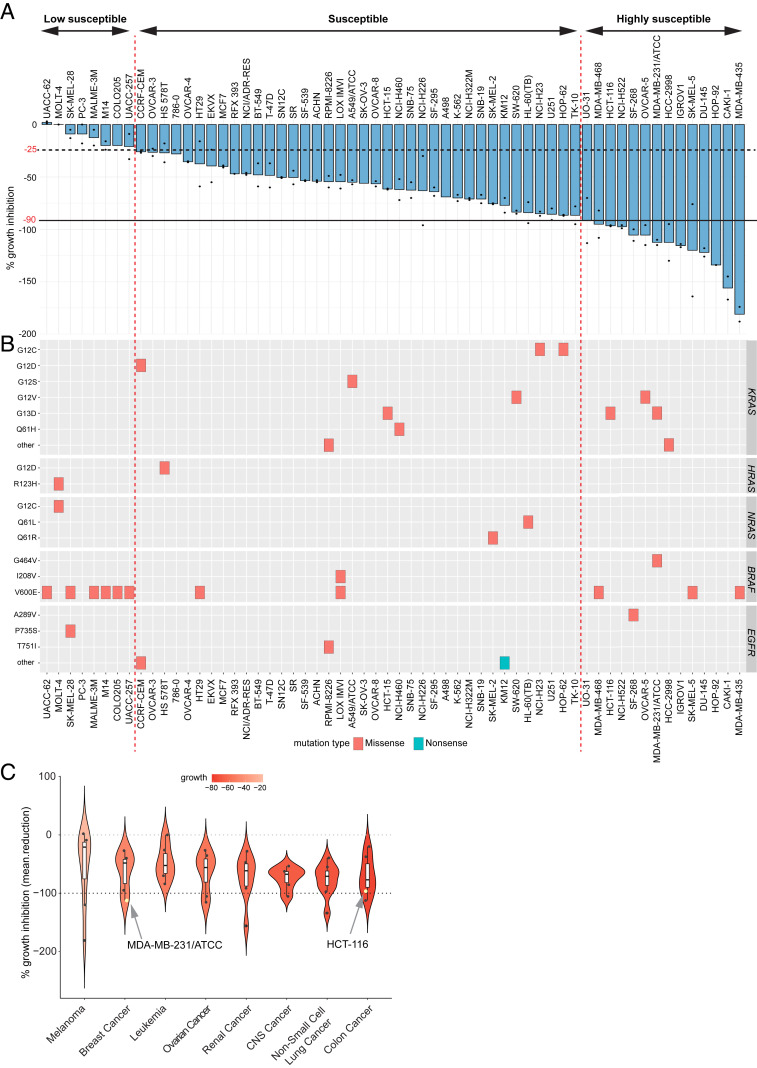
Fig. 4.
Comprehensive analysis of the effect of RRSP on the NCI-60 cancer cell line panel. (A) Bar plot showing the percentage of growth inhibition of RRSP-DTB in the NCI-60 panel. Cancer cell lines were ranked in descending order based on their growth inhibition percentage value. The presence of two dots on the bars indicates that two replicates were performed per each cell line, and bars represent means. No dots indicate that only one replicate was available. (B) Spectrum of missense and nonsense mutations in KRAS, HRAS, NRAS, BRAF, and EGFR genes in the 60 cell lines of the panel. (C) Violin plot showing the median percentage of growth inhibition of cell lines treated with RRSP-DTB and grouped per tumor type in descending order. Only tumor types that had at least five cell lines per group were plotted on the graph.

