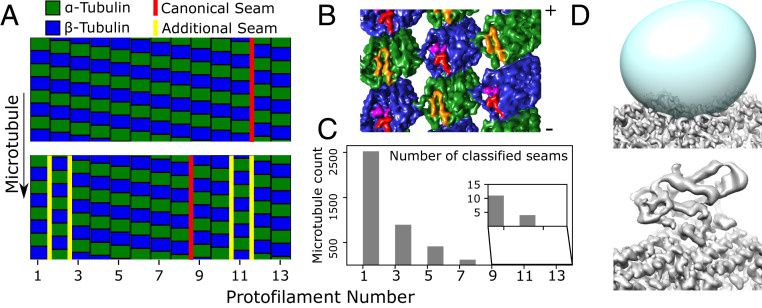
Fig. 3.
Classification of individual protofilaments/subunits identifies multiseam microtubules (A–C) as well as bound proteins (C). (A) Classification results for a single-seam microtubule (Top, marked in red), and a five-seam microtubule (Bottom). Two protofilaments in the five-seam microtubule are displaced by half the dimer repeat distance, generating four seams (yellow) in addition to the canonical seam (red). (B) Three-dimensional reconstruction of out-of-register protofilaments as in A; the map (viewed from the microtubule lumen) illustrates the two additional seams created. ⍺-Tubulin is colored green with the S9-S10 loop colored orange, while β-tubulin is blue with the S9-S10 loop in red and Taxol in purple. Note that this reconstruction was generated using helically refined coordinates to reduce the possibility of a spurious artifact resulting from, i.e., overfitting during protofilament refinement (SI Appendix, Fig. S3). (C) Quantification of the number of multiseam microtubules. Note that 1.5-start microtubules as seen here (corresponding to a 1.5-start helix of tubulin dimers with 8 nm axial repeat spacing, equivalent to a three-start helix of generic tubulin monomers with 4 nm axial repeat spacing) have an odd number of seams, due to geometric constraints (6, 36). (D) Classification of the kinesin binding site. The averaged microtubule structure (Top) shows a vacant kinesin binding site, due to low occupancy of the motor protein. The predicted kinesin binding location is defined by a mask (Top, in cyan), which is used to subtract away the remaining tubulin density from boxed microtubule segments. Classification of the resulting image stack identifies a bound state (Bottom), in addition to the unbound state that closely resembles the average structure.

