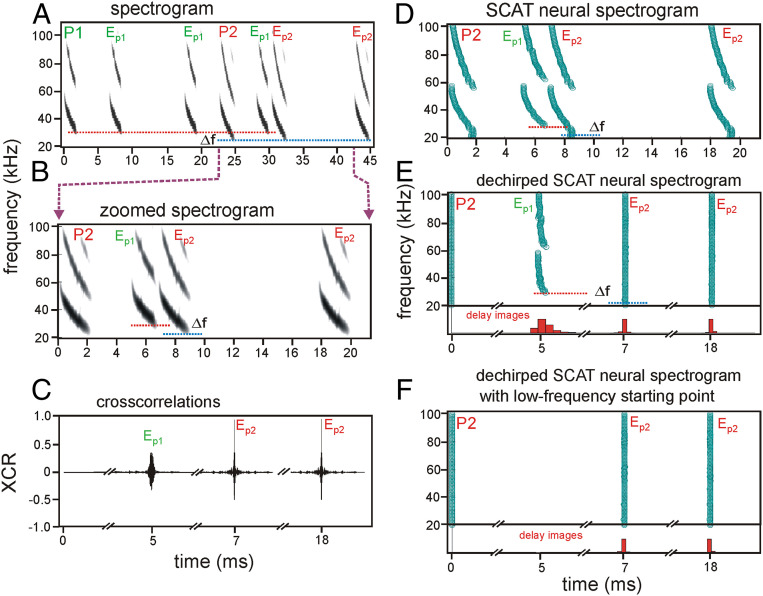
Fig. 4.
The SCAT model can segregate echoes of different broadcasts by frequency hopping. (A) Spectrograms for two FM successive biosonar pulses with frequency hopping Δf (P1, P2) recorded using the telemike and several of their echoes (EP1, EP2) arranged in a sequence to test cross correlation (B and C) and SCAT determination of delay (D–F). (B) Spectrograms from A zoomed in to show P2 and the echoes that follow in its echo epoch. (C) Transformation of P2 and echoes from B into cross-correlation functions using P2 as the template. Both the correctly corresponding echoes (Ep2) and the ambiguous echo (Ep1) are highly correlated with P2, indicating acceptance of the ambiguous echo along with the correct echoes. Differences in cross-correlation peak height and cross-correlation width might seem adequate to reject the ambiguous echo, but height is the reflective object’s size, and width is the object’s shape, both of which vary considerably in real clutter such as vegetation (43–46), rendering them effectively stray parameters. (D) SCAT spectrograms for the same sounds as for the spectrograms in B. (E) SCAT can segregate echoes when the lowest frequencies are present. Dechirped spectrograms of signals in D plotted by shifting the time of occurrence of each frequency in P2 to time 0. Note vertical rows of points for both echoes EP2 and a slightly mismatched row of points for EP1. (F) When the lowest frequencies in P2 are absent, SCAT cannot determine the delay estimate by frequency hopping.

