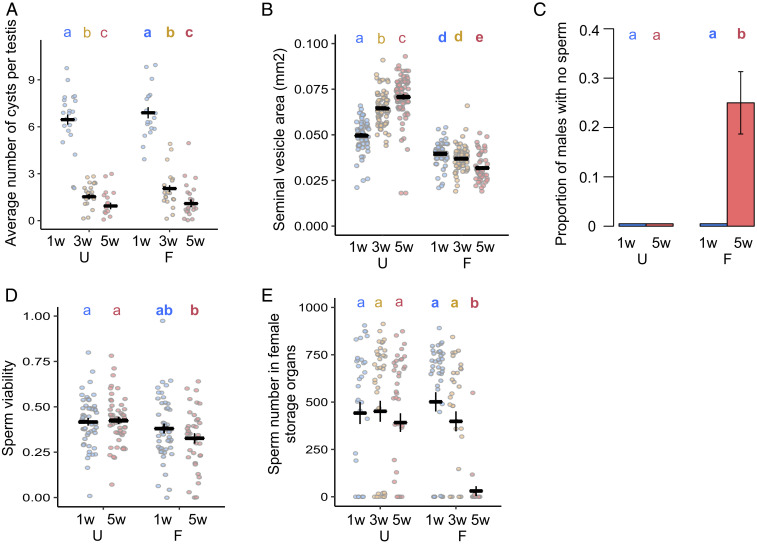
Fig. 4.
Aging and mating impact sperm production and transfer. (A) Average number of mature germline cysts per testis (a measure of sperm individualization rate) (age: χ22 = 223.78; P < 0.0001; mating: χ21 = 1.334; P = 0.119; age and mating interaction: χ22 = 0.772; P = 0.496) (n = 16–22). (B) Seminal vesicle area (mm2) (age and mating interaction: F22 = 68.494; P < 0.0001) (n = 49–79). (C) Proportion of males with no evidence of sperm within the seminal vesicle (n = 47–51). (D) Sperm viability 10 min after removal from the seminal vesicles (male age: χ21 = 0.308; P = 0.871; mating group: χ21 = 121.59; P = 0.001; interaction between male age and mating group: χ21 = 13.537; P = 0.282) (n = 36–51). (E) Number of GFP fluorescent sperm heads in female sperm storage organs 90 min after mating starts (binomial: age and mating interaction: χ22 = 13.417; P = 0.0012; count: age and mating interaction: χ22 = 726.46; P = 0.0062) (n = 22–43). Results are shown as means ± SEM. Differences at P < 0.05 within mating groups and age categories are represented as different letters.

