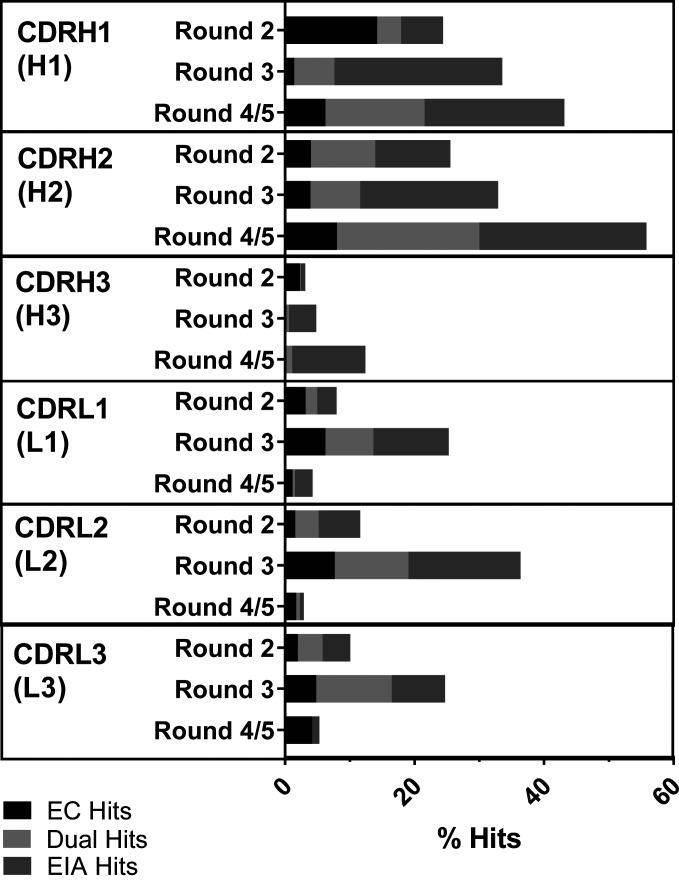
Fig. 2.
Hit rates from the outputs of CDR optimization. The outputs from each selection round for each CDR were prepared as crude scFvs in periplasmic extracts in a 96-well format and screened using the EC and EIA assays. The parental antibody C0020187 was used as a benchmark in both assays, against which significantly improved clones were identified as hits. The percentage hit rates (number of hits/number screened × 100) for the outputs from each CDR are represented in a bar graph for each round. Each bar is further broken down to indicate whether they were EC hits, EIA hits, or hits in both assays (dual hits).

