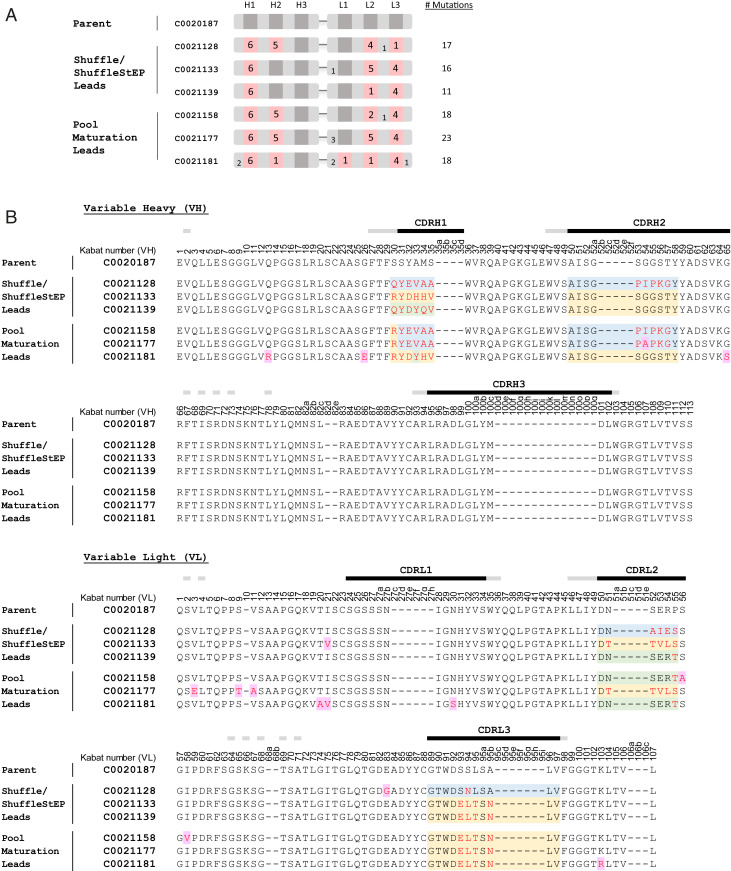
Fig. 6.
Sequence comparison of optimized antibodies with the parent. (A) A schematic showing the position and number of residues which have been mutated in each affinity-matured lead. Mutated CDRs are shown in pink. The number of mutations in each region is annotated on the blocks. (B) The amino acid sequence alignment of the affinity-matured leads to the parent C0020187. The residues are annotated according to Kabat numbering (25). CDR regions are marked with black bars, with flanking Vernier residues marked with gray. The residues that differ from the parent in the affinity-matured antibodies are in red type. Sequences in selected targeted regions that differ between the Shuffle, ShuffleStEP, and pool-maturation leads are highlighted in blue, yellow, and green based on sequence similarity to each other. Amino acids that were likely to have arisen through EP mutagenesis or spontaneous mutation (as they were not targeted in the mutagenesis scheme or descended from a parental construct) are highlighted in purple.

