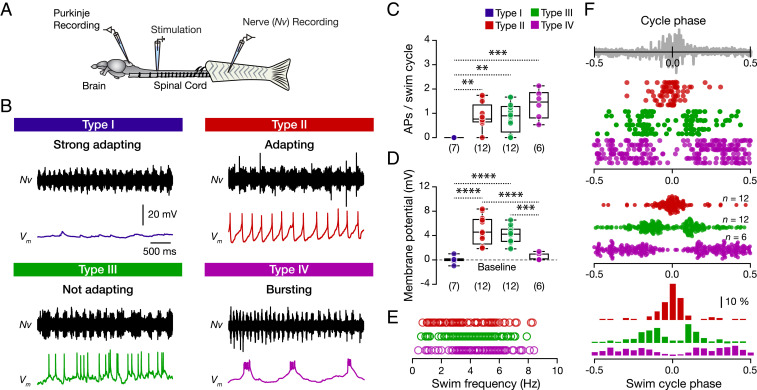
Fig. 3.
Adult zebrafish Purkinje cell type-specific activity during locomotion. (A) Ex vivo setup of the brain-spinal cord allows simultaneous recordings of Purkinje cells and ipsilateral motor nerves. Stimulating descending inputs elicit a swimming episode. (B) Sample recordings from each Purkinje cell type during locomotion. (C) Purkinje cell types II, III, and IV discharged during locomotion; type I did not fire (P = 0.0003, one-way ANOVA/Tukey’s post hoc test). (D) Significant changes to more depolarized membrane potential were observed in type II and type III Purkinje cells during locomotion (P < 0.0001, one-way ANOVA/Tukey’s post hoc test). (E) Graph showing the activity of the different Purkinje cells as a function of the instantaneous swimming burst frequency. Individual data points represent the instantaneous swimming frequencies of all swimming cycles where the respective Purkinje cell produced at least one action potential. (F) Purkinje cells show type-specific phase-locked activity during the swim cycle. (Top) The activity of six individual Purkinje cells from each type. (Middle and Bottom) Population data from all of the Purkinje cells recorded from each type, followed by a frequency distribution graph. The gray trace is a representative motor nerve recording showing the duration of the swim cycle. 0 defines the pick of the motor nerve activity. Data are presented as box plots showing the median with 25/75 percentile (box and line) and minimum–maximum (whiskers). **P < 0.01; ***P < 0.001; ****P < 0.0001. For detailed statistics, see SI Appendix, Table S1.

