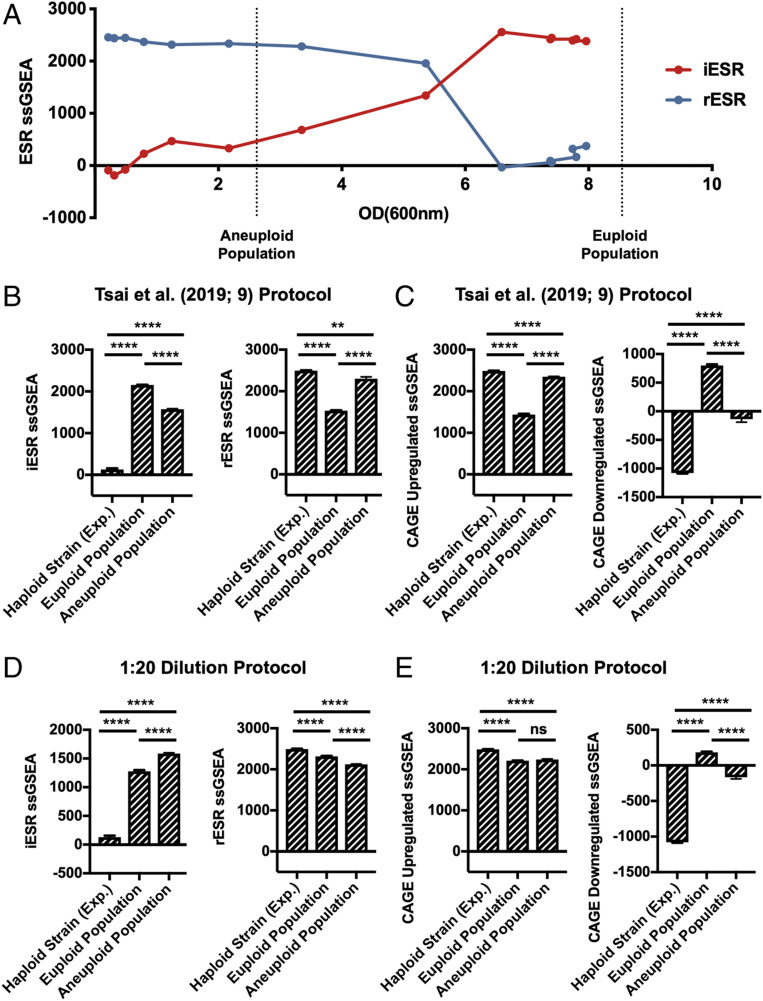
Fig. 2.
Effects of culture density on ESR strength in aneuploid cell populations. (A) iESR (red) and rESR (blue) ssGSEA projection values were determined at the indicated OD(600 nm) for S288C wild-type haploid cells (A2050) grown in YEPD over 28 h. Vertical lines represent the OD(600 nm) values of pooled euploid and aneuploid cell populations generated by tetrad dissection. Error bars represent SD from the mean of technical replicates. (B and C) Tetrads of sporulated S288C diploid and triploid cells (A40877 and A40878) were dissected to produce heterogeneous haploid and aneuploid cell populations, respectively. A total of 144 individual haploid colonies and 432 aneuploid colonies were inoculated and grown overnight in 200 μL YEPD. The next morning 300 μL YEPD were added to cultures and grown for an additional 5 h. Individual euploid and aneuploid cultures were then pooled and their transcriptomes analyzed. An exponentially growing haploid strain (A2050) was included as a control. Gene-expression data were analyzed by calculating ssGSEA projection values for the (B) iESR and rESR and (C) CAGE up-regulated and down-regulated genes. Error bars represent SD from the mean of technical replicates; one-way two-tailed ANOVA test with multiple comparisons and Bonferroni correction, P < 0.0001 (****), P = 0.0021 (**). For additional statistical analysis see SI Appendix, Fig. S4. (D and E) Tetrads of sporulated S288C diploid and triploid cells (A40877 and A40878) were dissected to produce heterogeneous haploid and aneuploid cell populations, respectively. A total of 144 individual haploid colonies and 432 aneuploid colonies were inoculated and grown overnight in 200 μL YEPD. The next morning cultures were diluted 1:20 and grown for an additional 5 h. Colonies were then pooled, further diluted to approximately OD(600 nm) = 0.3, and grown for 2 additional hours. Transcriptomes of pooled euploid and aneuploid populations and an exponentially growing haploid strain (A2050) were analyzed with RNA-Seq, and ssGSEA projection values were calculated for (D) iESR and rESR and (E) CAGE up-regulated and down-regulated genes. Error bars represent SD from the mean of technical replicates; one-way two-tailed ANOVA test with multiple comparisons and Bonferroni correction, P < 0.0001 (****), P = 0.1234 (ns, no statistical significance). For additional statistical analysis see SI Appendix, Fig. S4.

